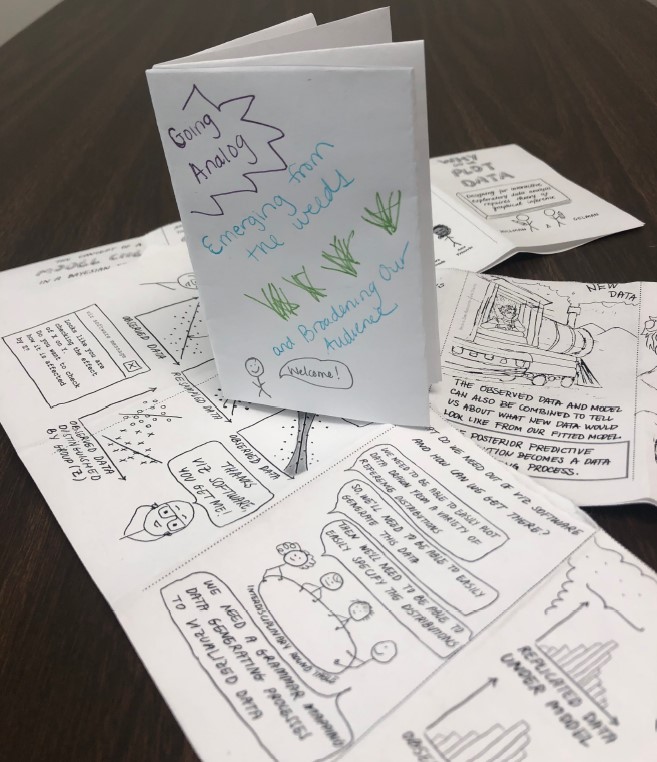
We could all use a break from our manuscripts (and our screens). Can thinking about our work in a new way help us re-energize? In this talk I’ll share some non-traditional data products that inspire me, some work I’ve been involved with inspired by these new mediums (including work with students), and some reflections about how expanding our sense of what “counts” as a research product can help us reach a broader audience.
Read more →
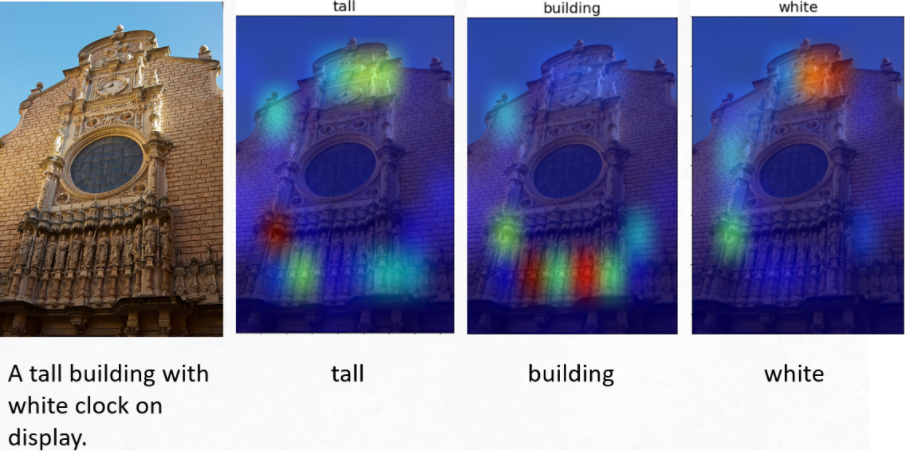
Automatic image captioning is the process of generating a descriptive text description for an image. Image captioning is one of the few applications of deep neural networks where we work with image and text data simultaneously. This captioning model can be trained using standard backpropagation techniques such as Stochastic Gradient Descent (SGD). I trained this model on the MS-COCO dataset with real-world images of humans, animals, vehicles, etc., in various situations and surroundings.
Read more →
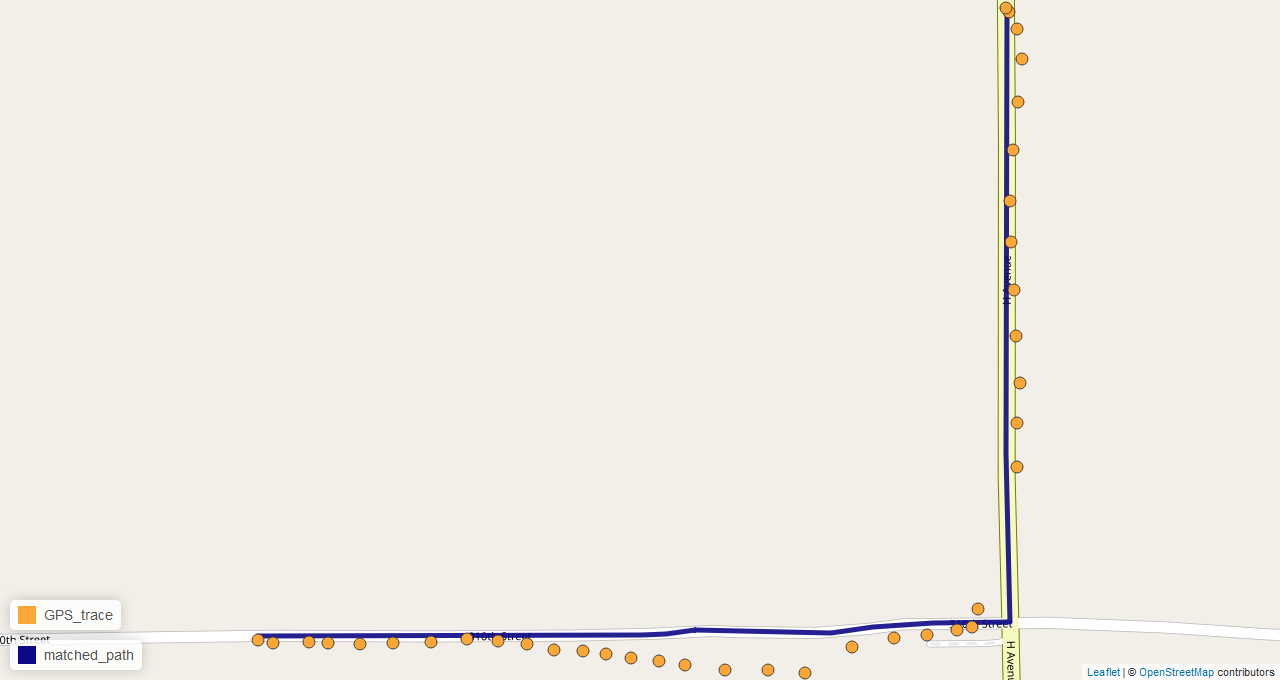
Map matching is an interesting problem that involves snapping noisy GPS traces to a road network with a high degree of accuracy. It is used by ride-sharing services such as Uber and Lyft, transportation researchers, highway agencies, auto insurance companies, and many others for gaining insights into driver behavior and travel patterns as well as improving operational efficiency. There are various commercial and open source map matching solutions available for use such as Google’s Snap to Roads API, Mapbox’ Map Matching API, and QGIS’s map matching plugin; however, these options are either very expensive (e.
Read more →
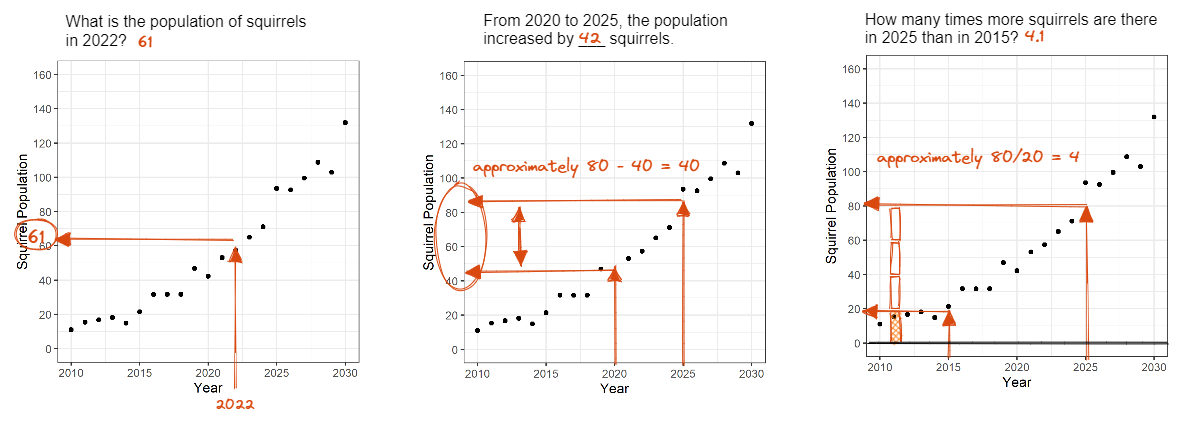
Questioning matters! The last graphical test for my research involves graph comprehension and extracting information from the chart. My talk will involve an interactive portion, inviting you to participate and provide feedback on the study. We will then discuss important aspects of graph comprehension and how they relate to selecting questions for the literal reading of data, reading between the data, and reading beyond the data. I will also share my Wikipedia literature review on intergalactic time conversions.
Read more →

Efficient data communication with colleagues is crucial in research. Although many statisticians and data scientists prefer standard text files or software specific data, like RData files, Microsoft Excel remains as a to-go software to create and store data for many researchers. MS Excel has many well-known detrimental effects, but it also has some perks that can be exploited, for example, hiding columns, imposing restrictions on columns, and creating hyperlinks. On the other hand, you can use a shiny app for a similar goal with more freedom via a shiny app if your colleagues have R installed.
Read more →