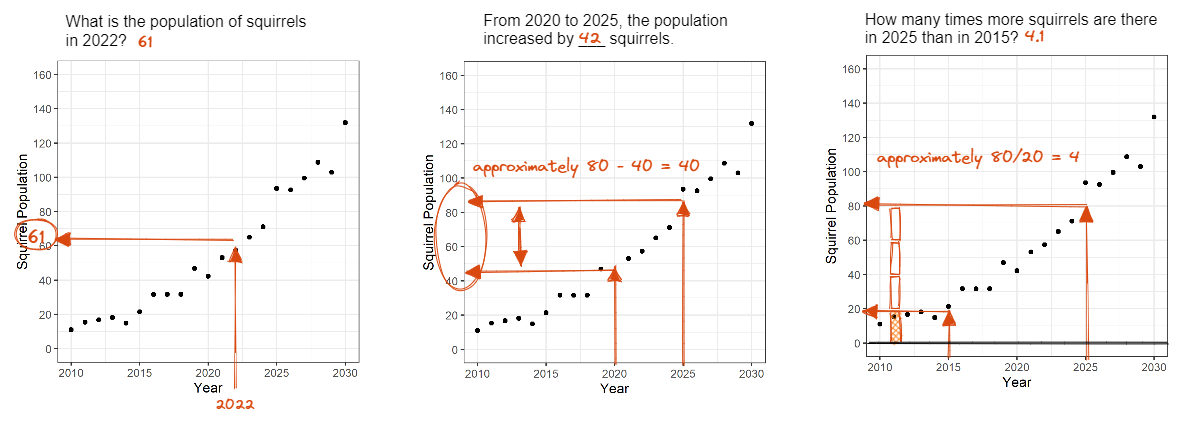
Questioning matters! The last graphical test for my research involves graph comprehension and extracting information from the chart. My talk will involve an interactive portion, inviting you to participate and provide feedback on the study. We will then discuss important aspects of graph comprehension and how they relate to selecting questions for the literal reading of data, reading between the data, and reading beyond the data. I will also share my Wikipedia literature review on intergalactic time conversions.
Read more →

How do statistical regression results compare to intuitive, visually fitted results? Fitting lines by eye through a set of points has been explored since the 20th century. Common methods of fitting trends by eye involve maneuvering a string, black thread, or ruler until the fit is suitable, then drawing the line through the set of points. In 2015, the New York Times introduced an interactive feature, called ‘You Draw It’, where readers are asked to input their own assumptions about various metrics and compare how these assumptions relate to reality.
Read more →


