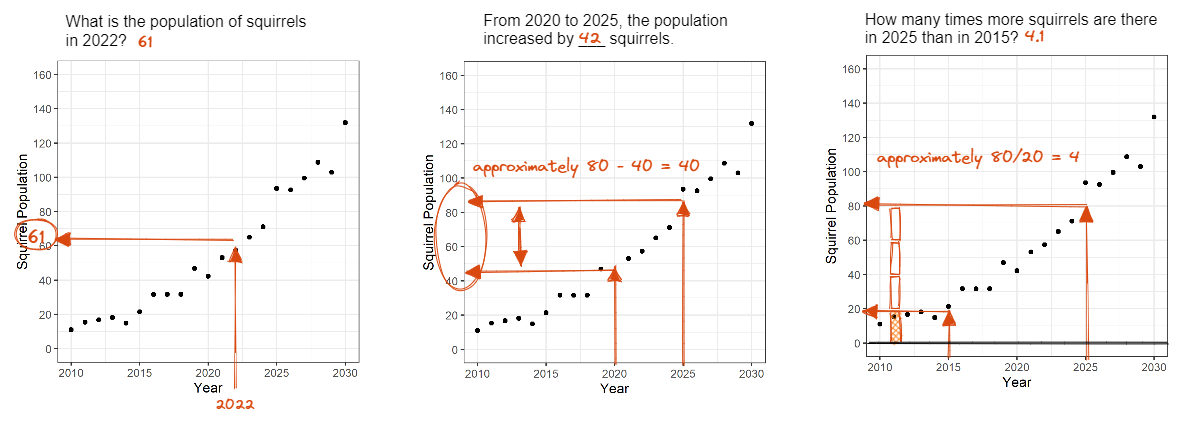
Questioning matters! The last graphical test for my research involves graph comprehension and extracting information from the chart. My talk will involve an interactive portion, inviting you to participate and provide feedback on the study. We will then discuss important aspects of graph comprehension and how they relate to selecting questions for the literal reading of data, reading between the data, and reading beyond the data. I will also share my Wikipedia literature review on intergalactic time conversions.
Read more →
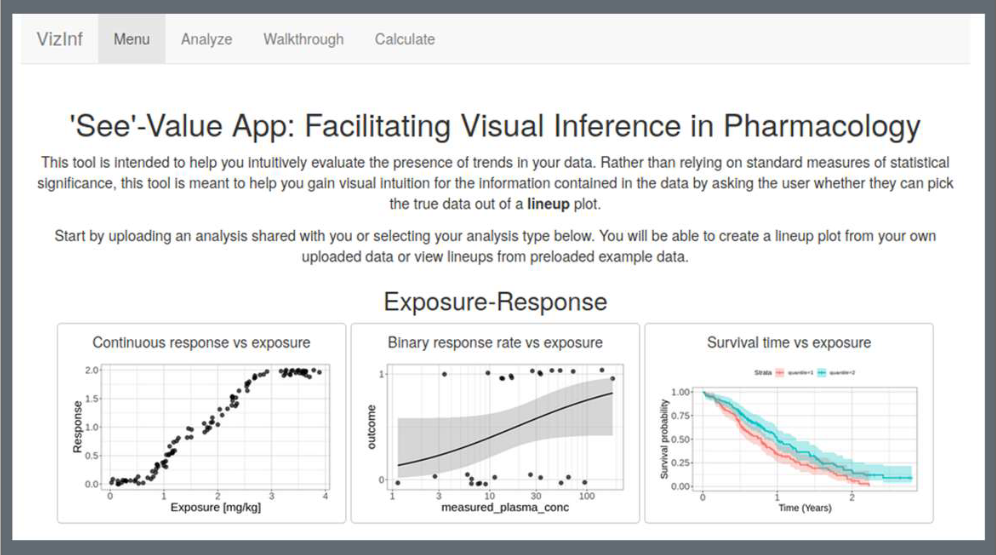
Humans are notorious at seeing patterns in plots even when there are none, especially when there is some incentive (e.g. financial) to do so. To avoid these pitfalls, the lineup protocol (Buja et. al 2009) calls for generating a number of simulated (“null”) plots and asking a user to try to pick out the real data from the rest. We created an R-shiny App that allows the user to generate these lineups by using preloaded examples or by uploading their own data.
Read more →

How do statistical regression results compare to intuitive, visually fitted results? Fitting lines by eye through a set of points has been explored since the 20th century. Common methods of fitting trends by eye involve maneuvering a string, black thread, or ruler until the fit is suitable, then drawing the line through the set of points. In 2015, the New York Times introduced an interactive feature, called ‘You Draw It’, where readers are asked to input their own assumptions about various metrics and compare how these assumptions relate to reality.
Read more →
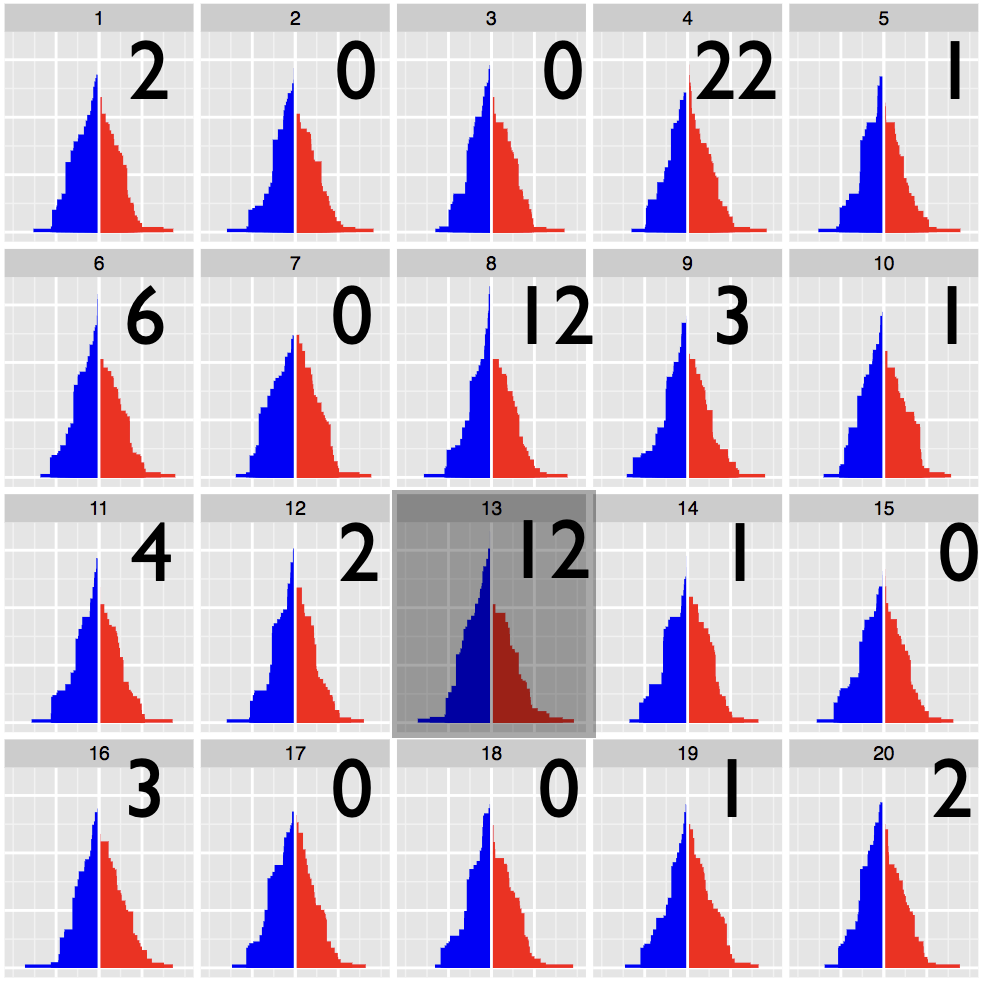
Statistical inference provides the protocols for conducting rigorous science, but data plots provide the opportunity to discover the unexpected. These disparate endeavors are bridged by visual inference, where a lineup protocol can be employed for statistical testing. Human observers are needed to assess the lineups, typically using a crowd-sourcing service. In this talk we will discuss how to calculate statistical significance associated with the results from applying a lineup protocol.
Read more →
Leveraging a variety of APIs and scraping methods, we assembled data from many different publicly available data sources, including local, state, and national government data. Combining this data (which is collected at many different spatial resolutions), we explore the factors contributing to quality of life in small towns in Iowa, using both supervised and unsupervised methods to identify clusters of similar towns. Working with stakeholders in the small towns, we create visualizations designed to give small towns access to their own data, helping them to make decisions which preserve quality of life amid shrinking population.
Read more →