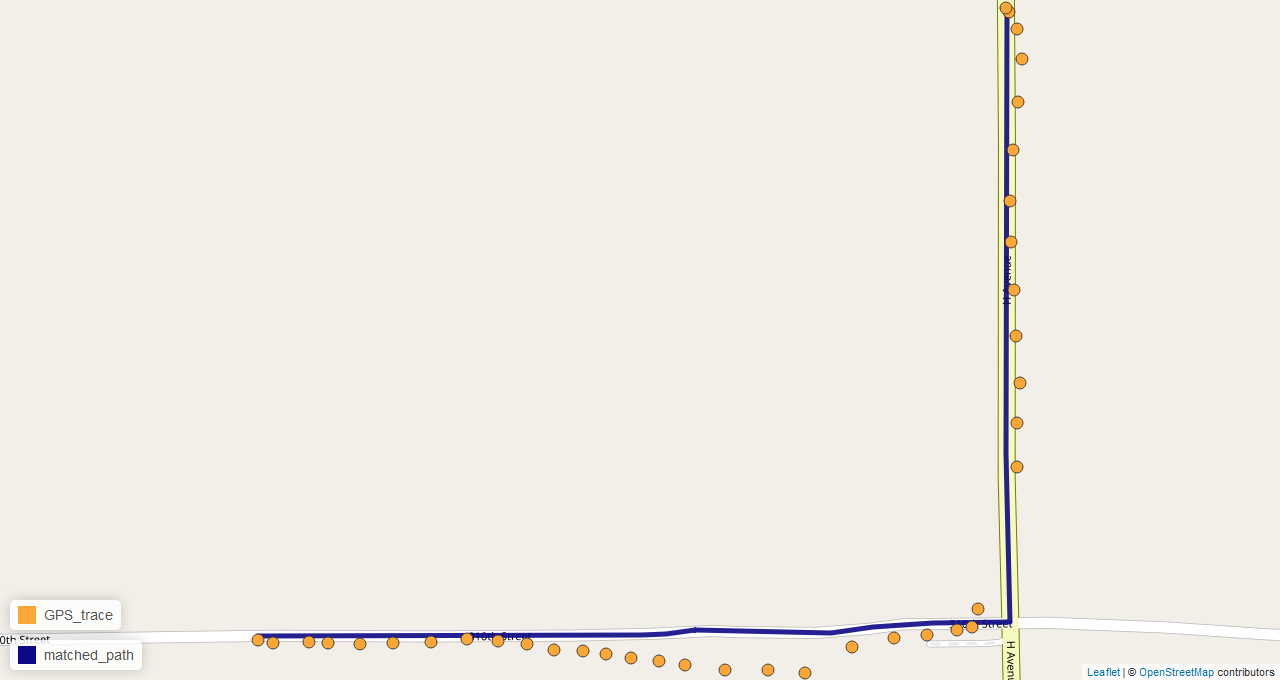
Map matching is an interesting problem that involves snapping noisy GPS traces to a road network with a high degree of accuracy. It is used by ride-sharing services such as Uber and Lyft, transportation researchers, highway agencies, auto insurance companies, and many others for gaining insights into driver behavior and travel patterns as well as improving operational efficiency. There are various commercial and open source map matching solutions available for use such as Google’s Snap to Roads API, Mapbox’ Map Matching API, and QGIS’s map matching plugin; however, these options are either very expensive (e.
Read more →

In the last couple years, the Tidyverse team has made a series of informative presentations, giving practical advice on how to “deal with” tidy evaluation: the framework used for non-standard evaluation in the Tidyverse. This interactive tutorial, available at http://ijlyttle.shinyapps.io/tidyeval/, has been reworked to focus on this practical advice: how to write functions for (1) Shiny apps, and (2) interactive use. The tutorial includes videos of the Tidyverse team’s presentations – which you might find interesting to watch in advance (or later).
Read more →
Several classes of time deconstructions can assist in the exploration and automated analysis of large temporal data sets. Cyclic time granularities, which are temporal deconstructions accounting for repetitive behavior, like hour-of-day, day-of-week, or special holidays can be used to create a visualization of the data to explore for periodicities, associations, and anomalies. Analysts are expected to comprehensively explore the many ways to view and analyze such graphics, however, the lack of a systematic approach to do so quickly becomes overwhelming.
Read more →

Past studies - Subjective Judgment in Statistical Analysis: An Experimental Study (D.J. Finney; 1951) and Eye Fitting Straight Lines (Mosteller et. al. 1981) - conducted graphics experiments to evaluate human perception of fitting best fit lines by eye through a set of points or a given trend. We bring this experiment into the modern era with r2d3, following a similar process to NYTimes You Draw It pages. In previous research, we conducted a graphical experimental task using lineups and visual inference to evaluate whether our ability to perceptually notice differences in exponentially increasing trends is impacted by the choice of scale.
Read more →

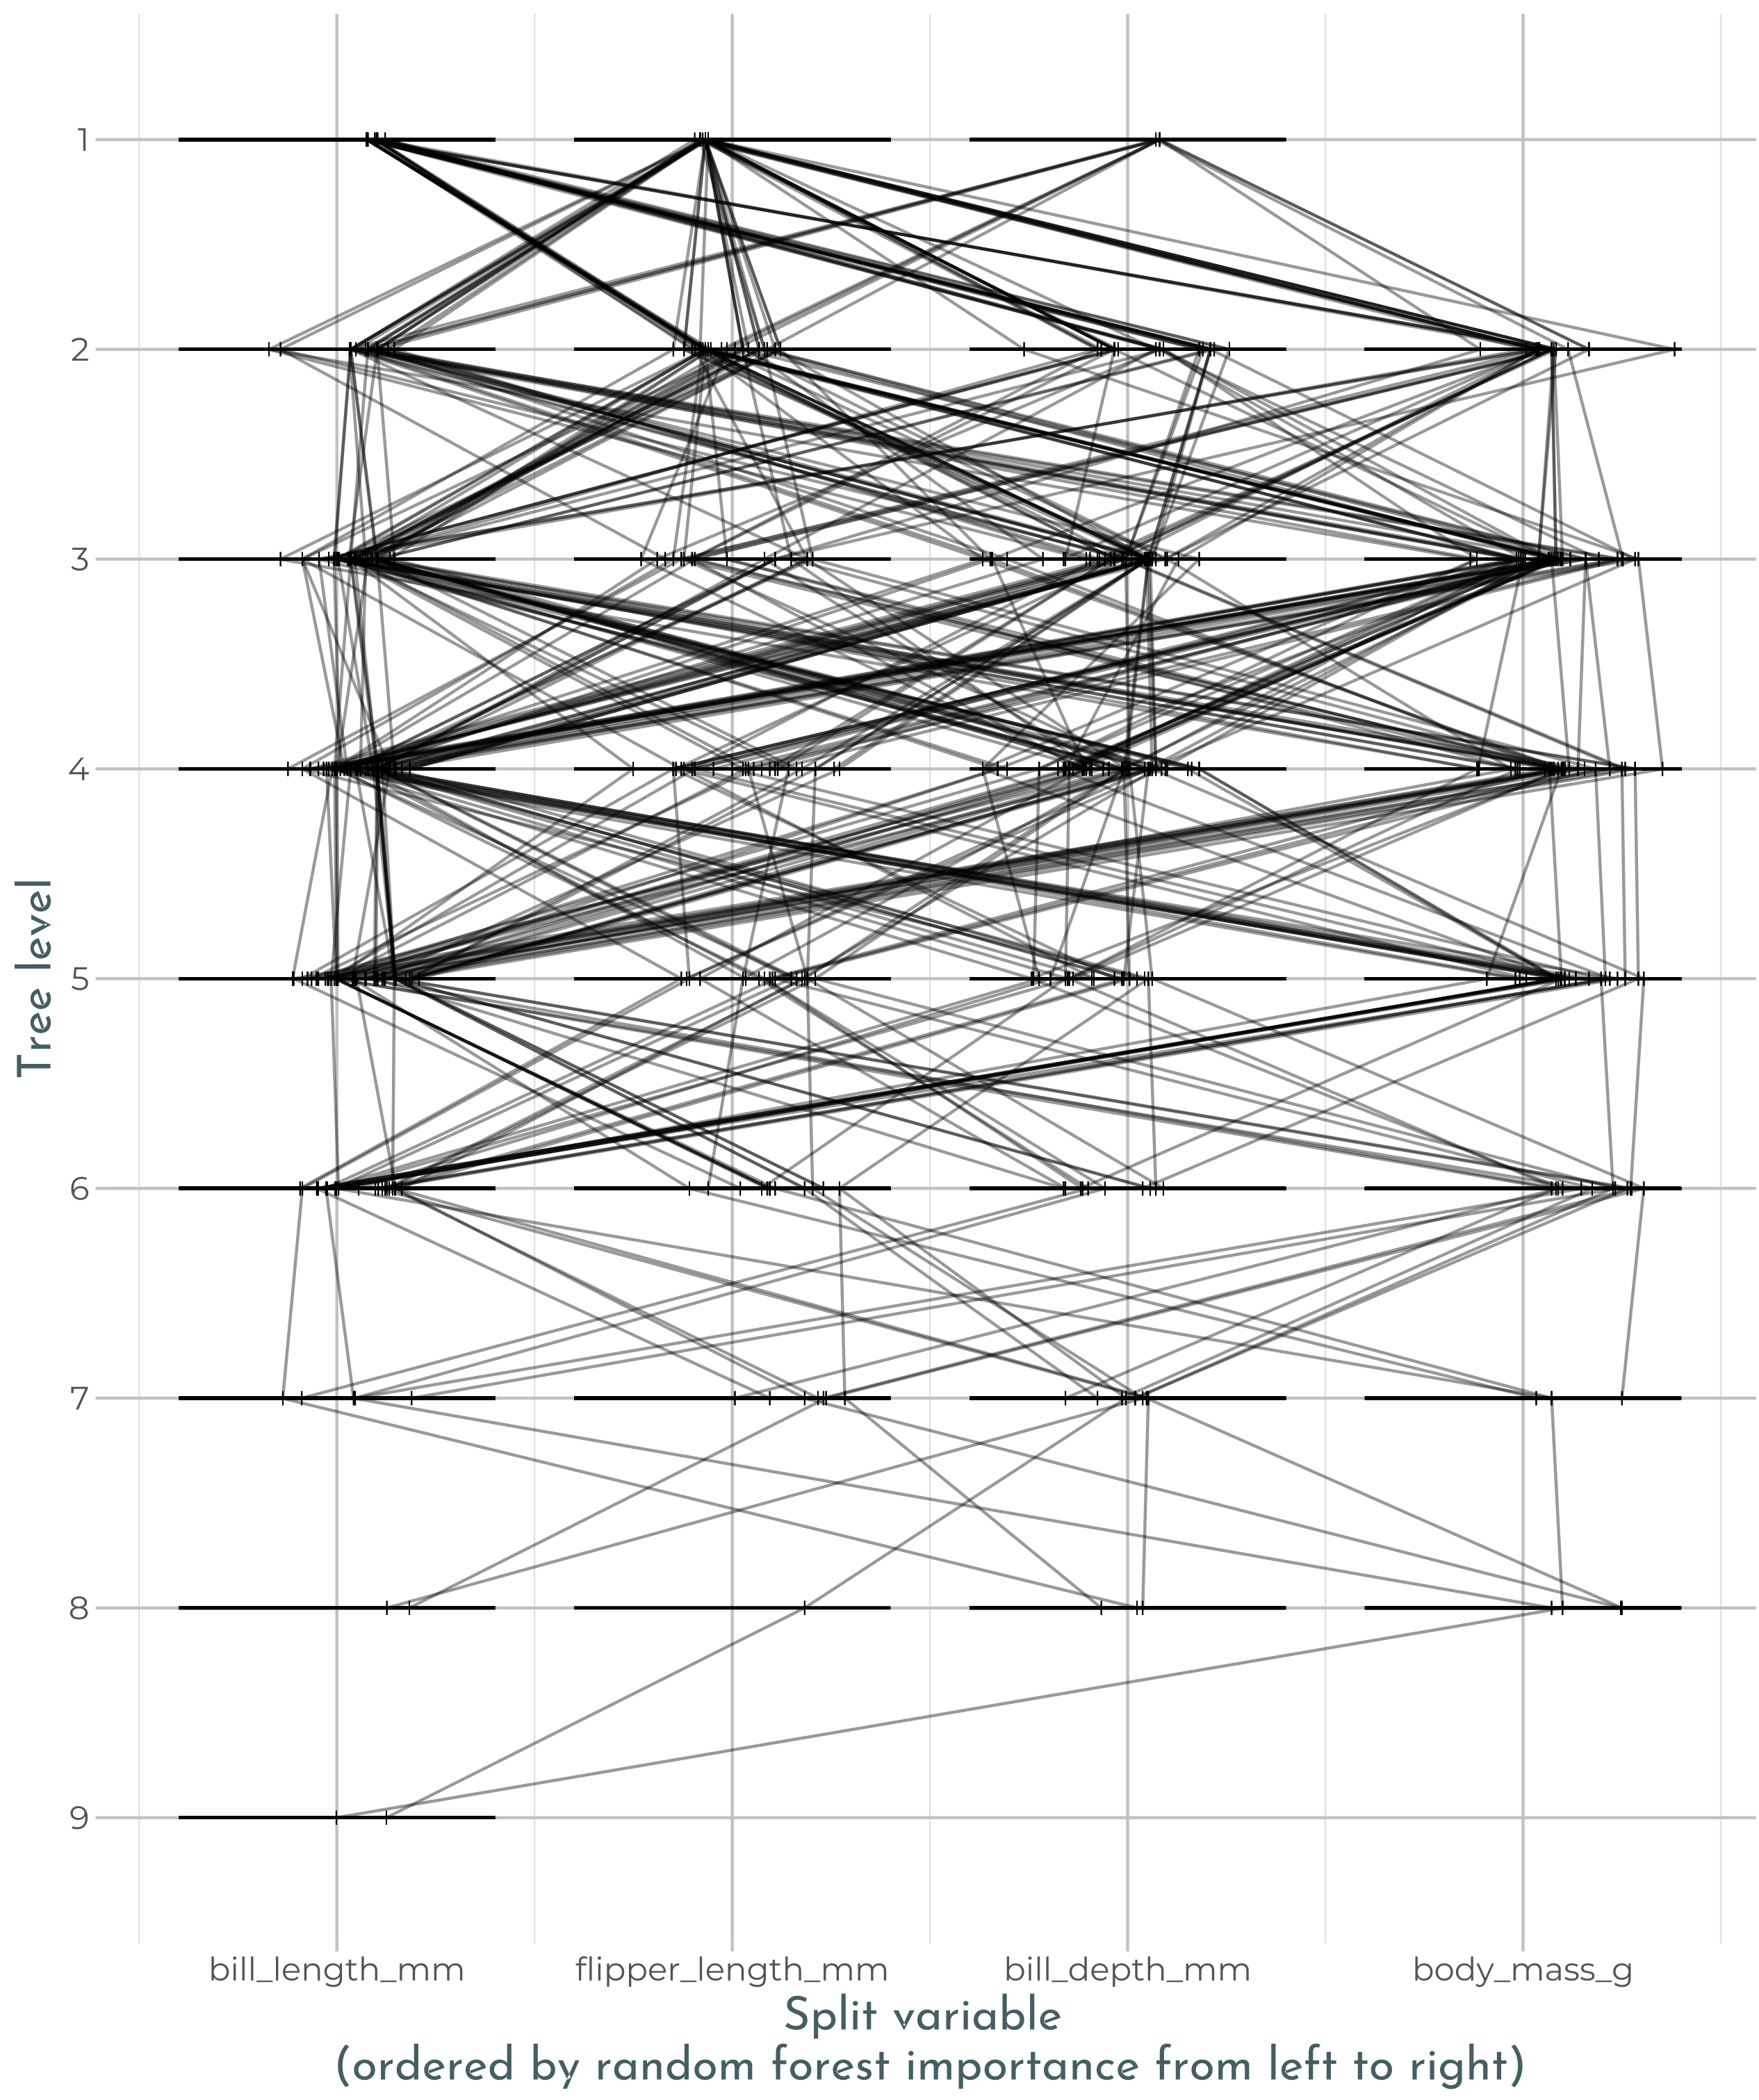
Random forests are a popular method for statistical applications with an objective of prediction. While an individual tree within a random forest provides a clear decision path for how a prediction is made, the ensemble of trees from the forest creates a complex decision process that is difficult to interpret. One approach used to gain insight into this decision process is visualization of the model. Various approaches have been taken to visualize random forests including trace plots developed by Simon Urbanek (https://link.
Read more →


