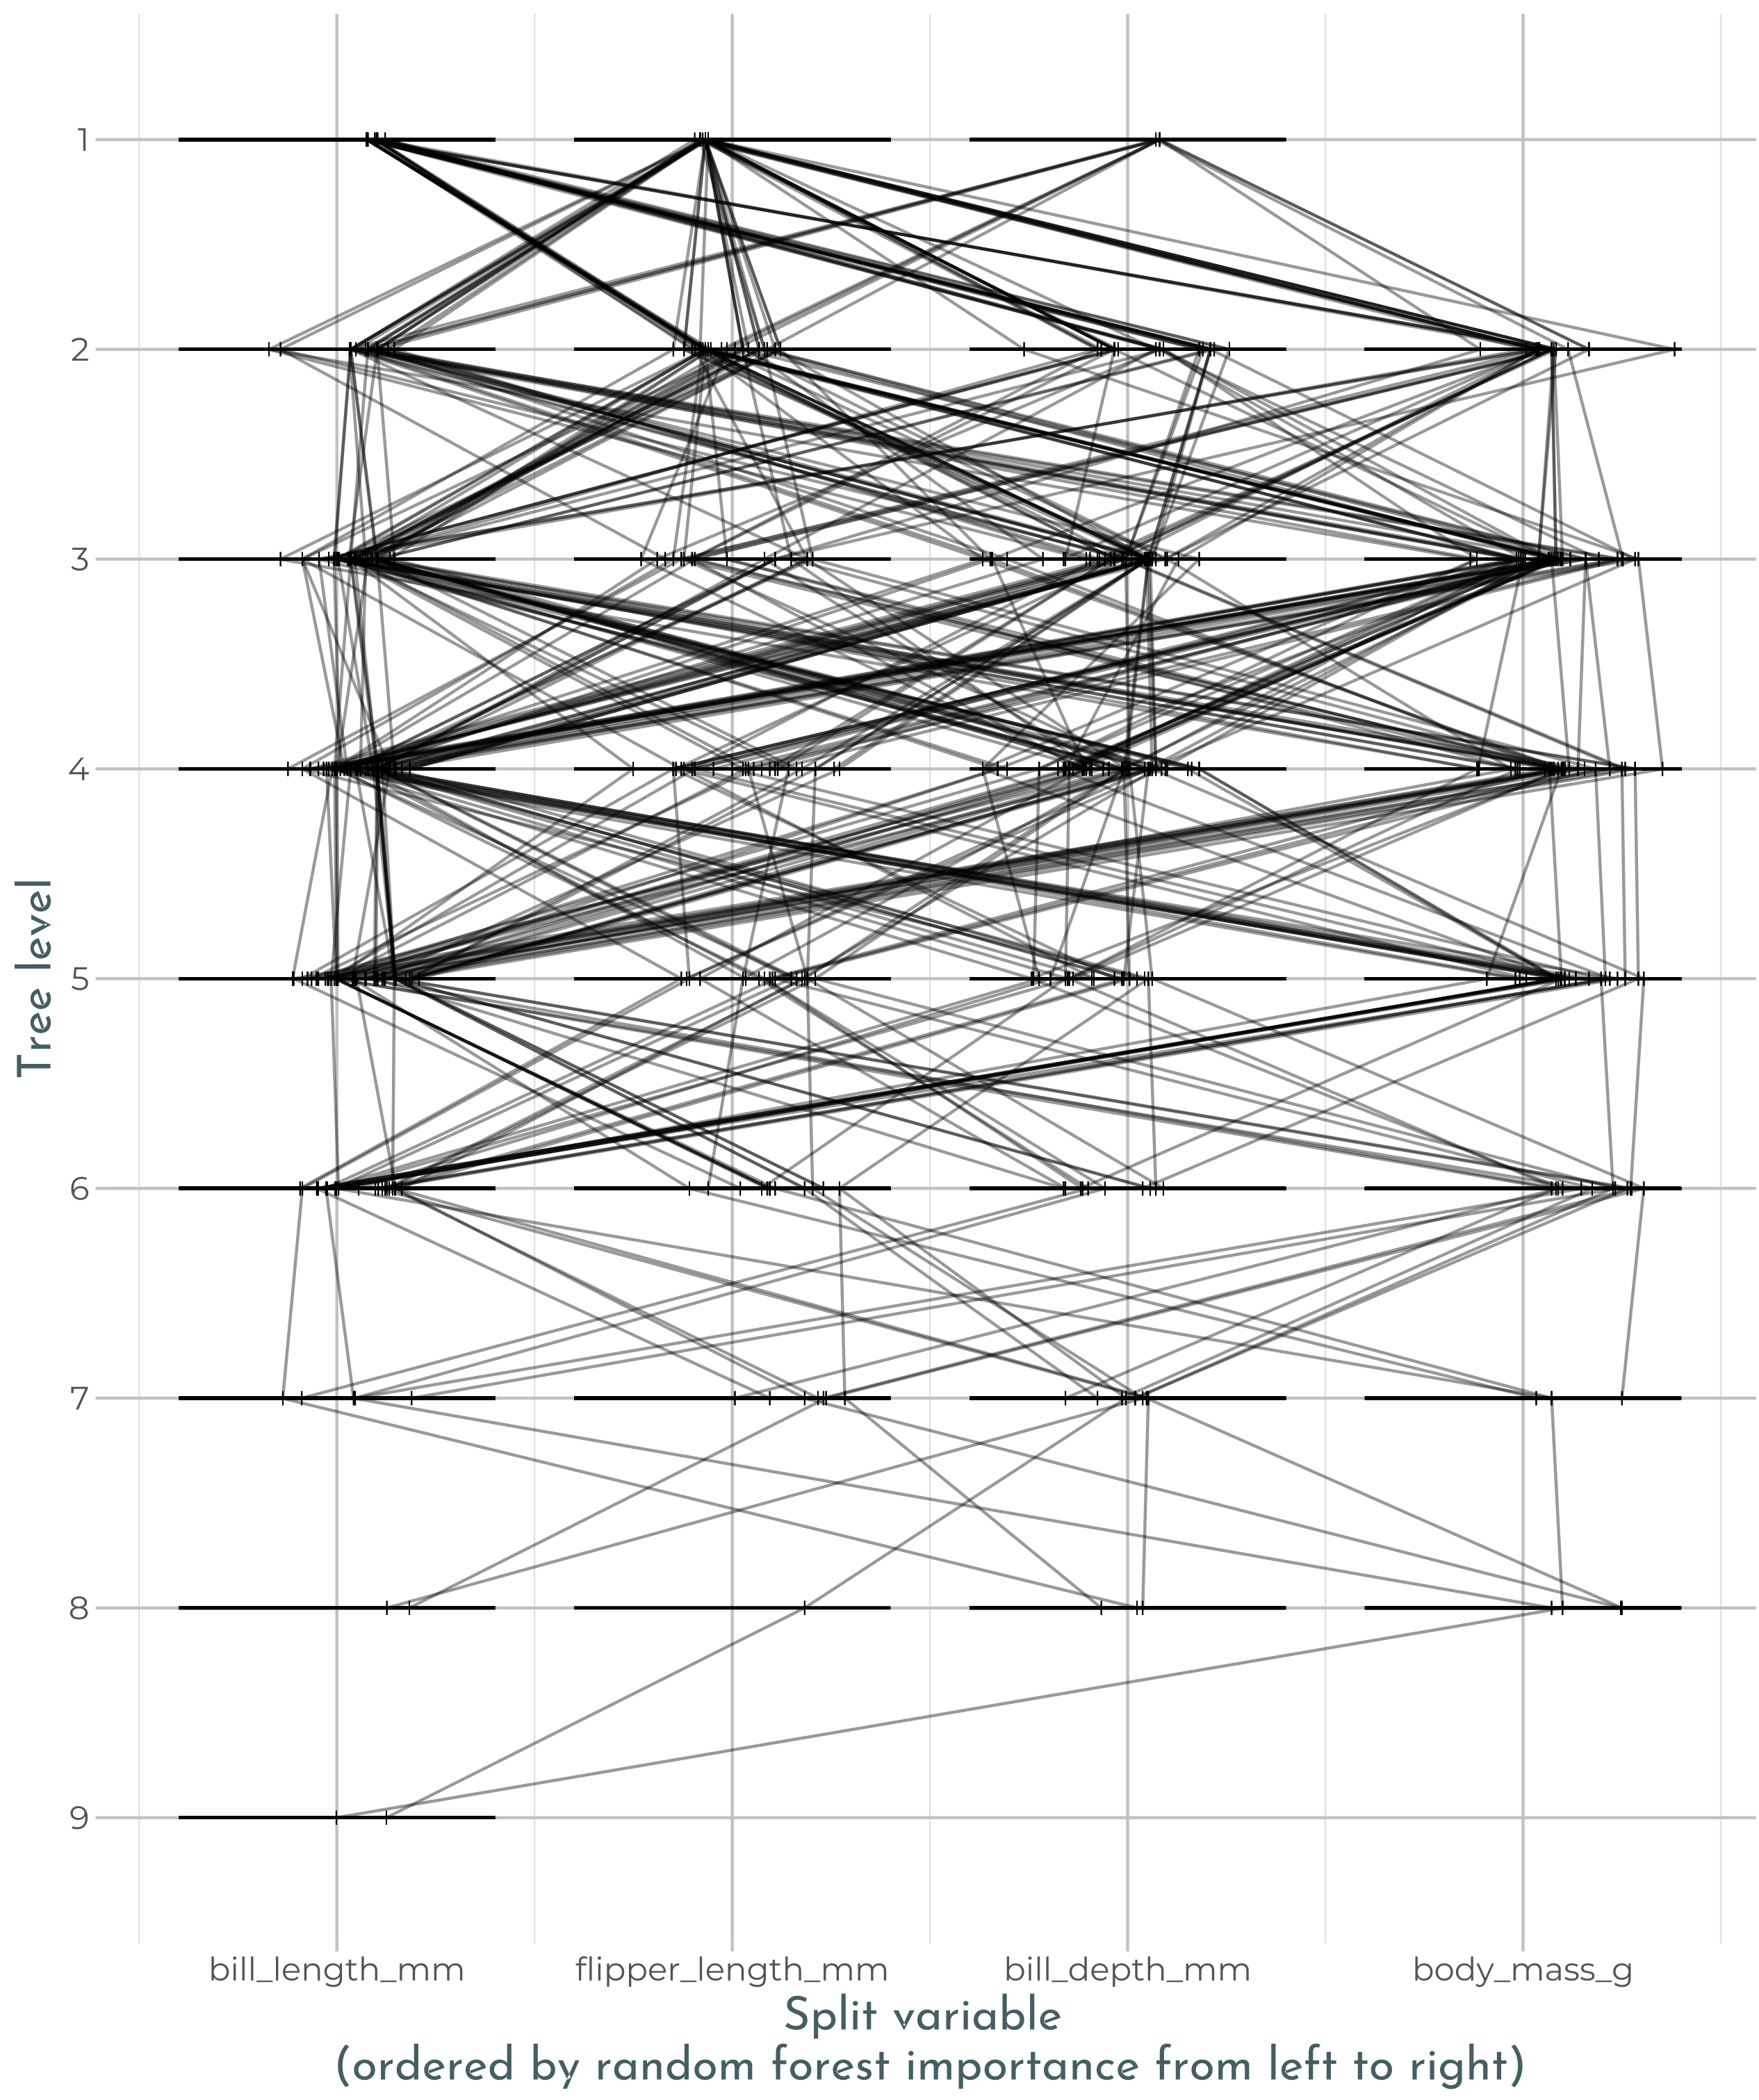
Random forests are a popular method for statistical applications with an objective of prediction. While an individual tree within a random forest provides a clear decision path for how a prediction is made, the ensemble of trees from the forest creates a complex decision process that is difficult to interpret. One approach used to gain insight into this decision process is visualization of the model. Various approaches have been taken to visualize random forests including trace plots developed by Simon Urbanek (https://link.
Read more →
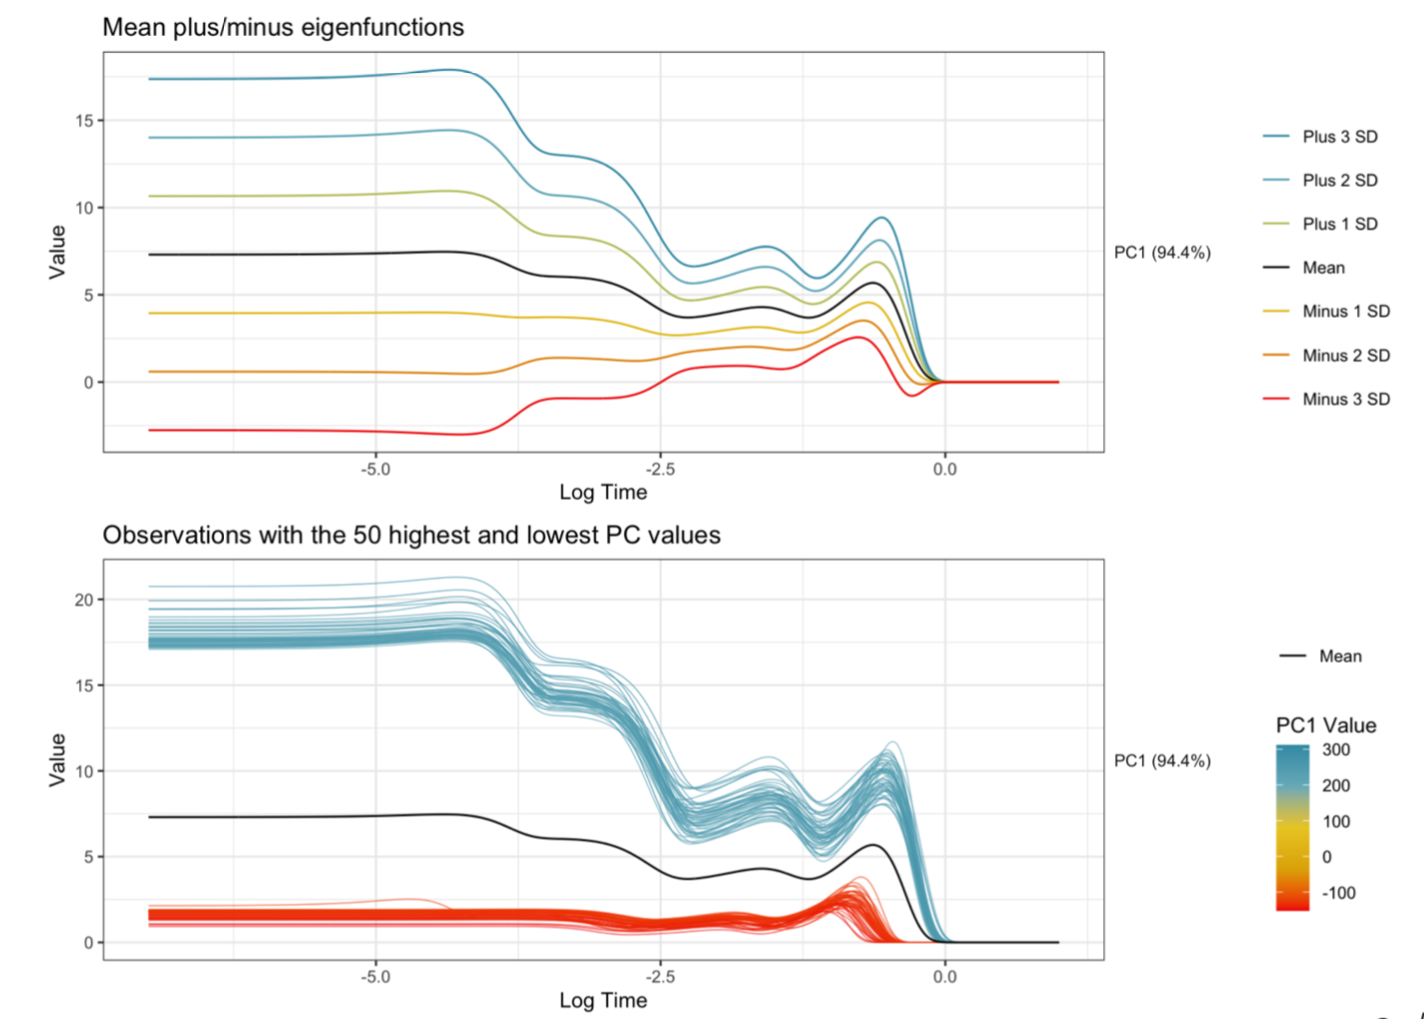
Explainable machine learning has become a quickly growing area of research as the use of black-box models continues to increase. While many methods have been proposed, little research has been done relating to applications involving functional data. As an intern at Sandia National Laboratories, I have been helping to develop methods to provide explanations for an application focused on predicting explosive device characteristics using optical spectral-temporal signatures from explosions. In this talk, I’ll discuss our approach that involves transforming the functions using functional principal component analysis, training neural networks on the functional principal components, and using permutation feature importance (PFI) to identify the principal components that are important for prediction.
Read more →
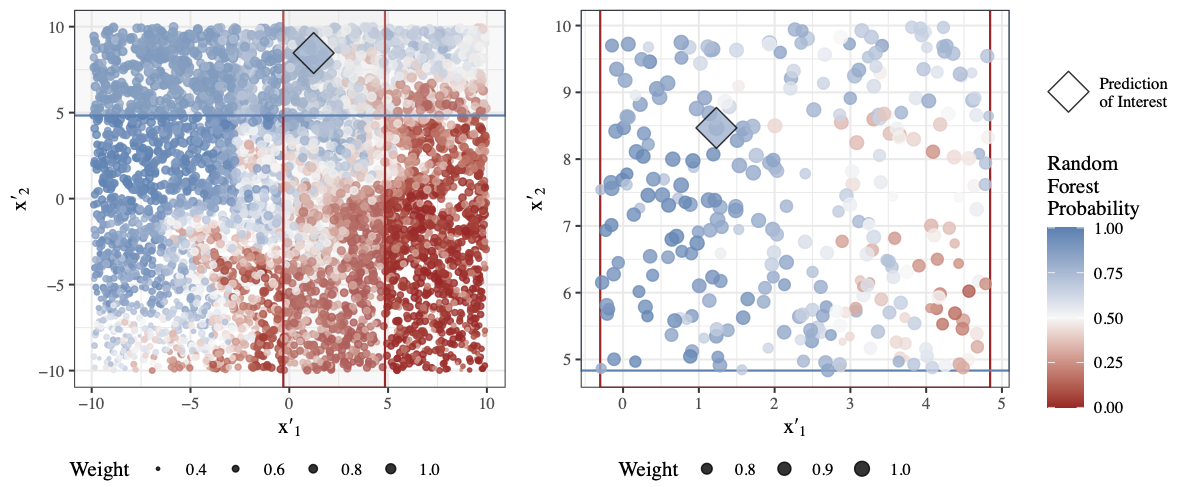
Machine learning models are excellent predictors, but it is impractical to interpret many of these models. Despite this impracticality, it is important to be able to explain predictions to assess and validate models. As a result, a field of research has recently developed in the explainability of machine learning models. In this talk, I will provide an overview of explainable machine learning with a focus on visualization methods. I will discuss philosophies of “explainability”, model agnostic and model specific visualization methods, and code for creating some of the visualizations in R.
Read more →
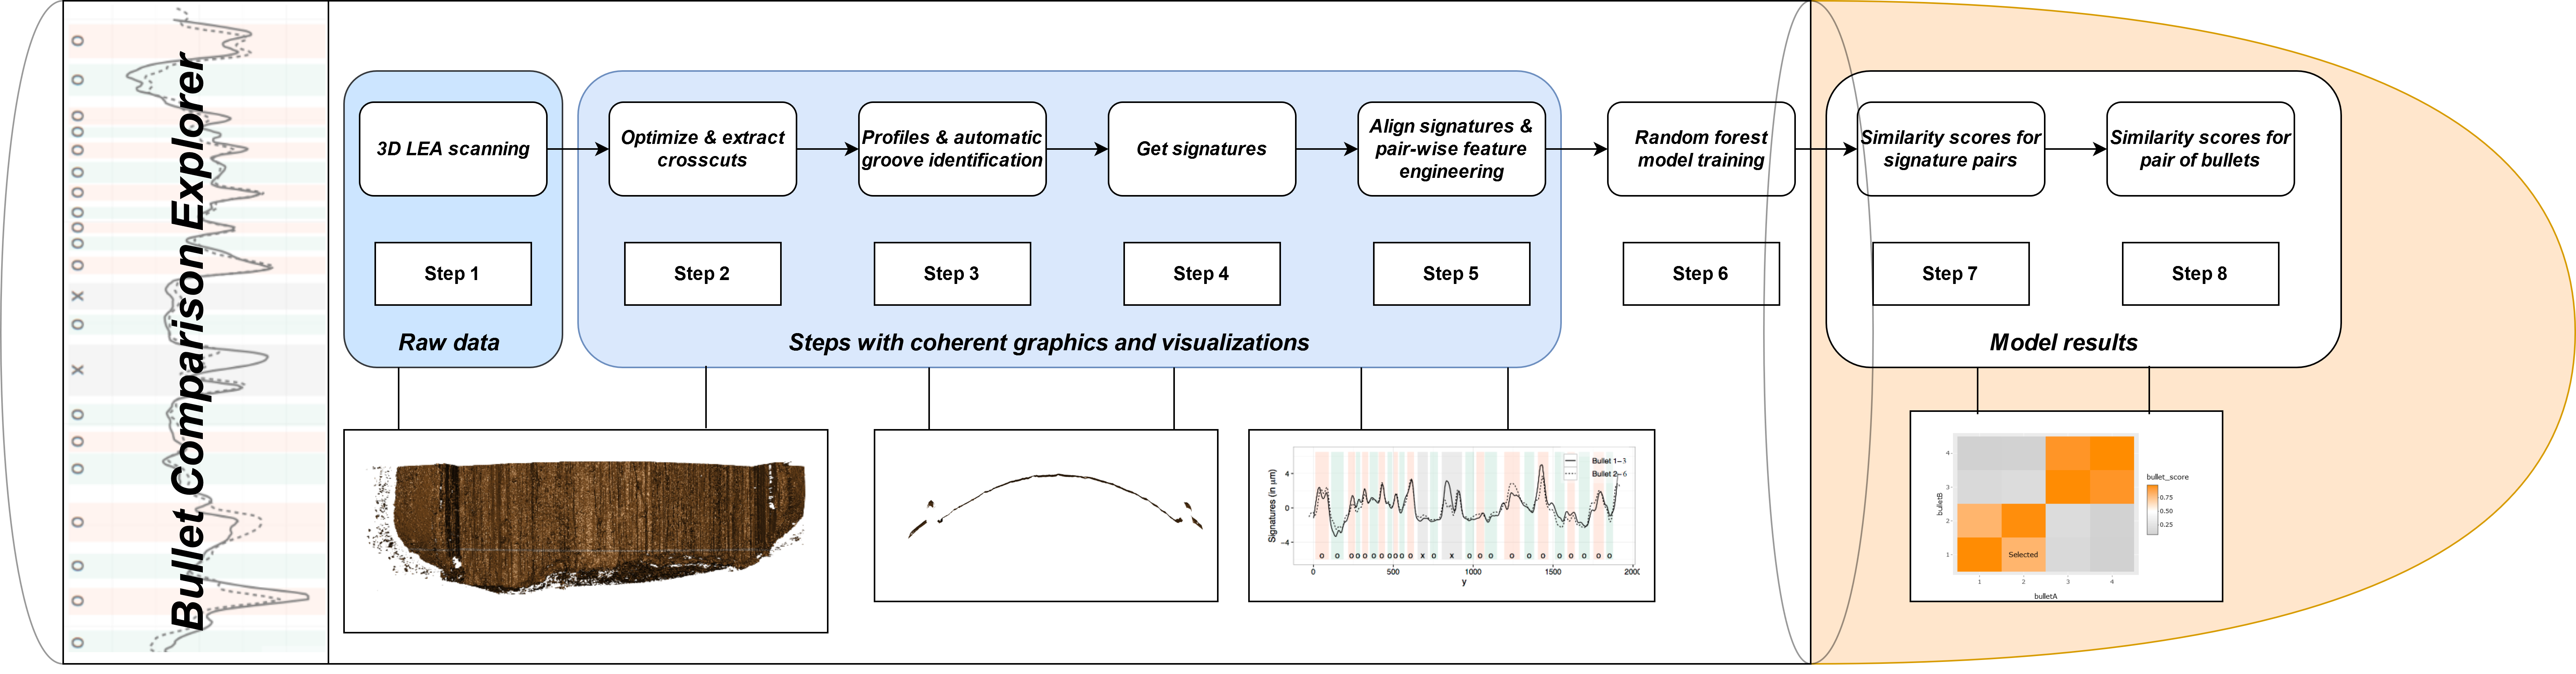
Forensic firearms examiners subjectively compare two bullets, using visual examination to make a determination about whether the bullets are similar enough to have originated from the same weapon. Recently, there has been increased demand for quantitative, objective similarity assessment methods for many types of forensic evidence, including bullets. In this talk, we discuss visualizations for a machine learning algorithm capable of matching striation marks on fired bullets. We describe the steps of the algorithm and summary visualizations used at each stage of the data science pipeline, and present an application which wraps the visualizations into an interactive exploration tool.
Read more →