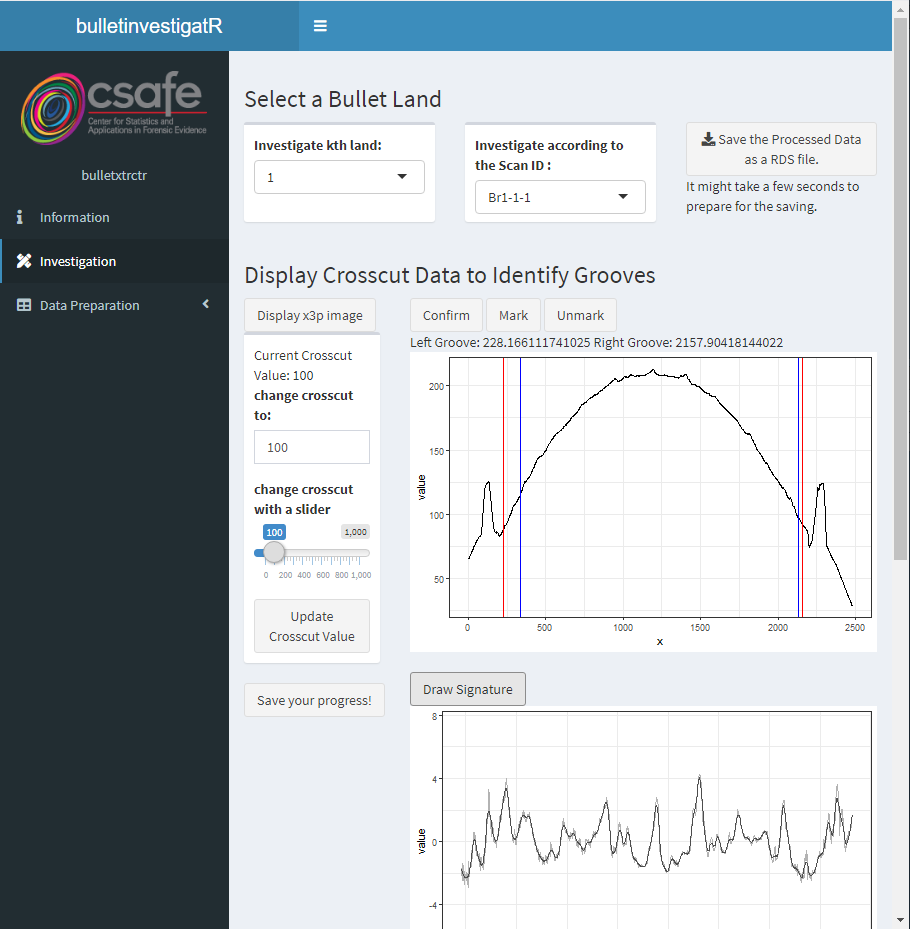
The R package bulletxtrctr provides many methods for analyzing bullet striations. And sometimes the results of these automated methods need some manual adjustments in order to be used in further analysis. To facilitate this process of manual adjustment and provide more insights into the data, we developed this interactive tool using Shiny. We also utilized Shiny Modules during the development of our app, which enables other developers to collaboratively extend the functionality of this app
Read more →

Taking projections of high-dimensional data is a common analytical and visualisation technique in statistics for working with high-dimensional problems. Sectioning, or slicing, through high dimensions is less common, but can be useful for visualising data with concavities, or non-linear structure. It is associated with conditional distributions in statistics, and also linked brushing between plots in interactive data visualisation. This talk will describe the simple approach for slicing in the orthogonal space of projections obtained when running a tour, thus presenting the viewer with an interpolated sequence of sliced projections.
Read more →

Forensic firearms examiners subjectively compare two bullets, using visual examination to make a determination about whether the bullets are similar enough to have originated from the same weapon. Recently, there has been increased demand for quantitative, objective similarity assessment methods for many types of forensic evidence, including bullets. In this talk, we discuss visualizations for a machine learning algorithm capable of matching striation marks on fired bullets. We describe the steps of the algorithm and summary visualizations used at each stage of the data science pipeline, and present an application which wraps the visualizations into an interactive exploration tool.
Read more →


