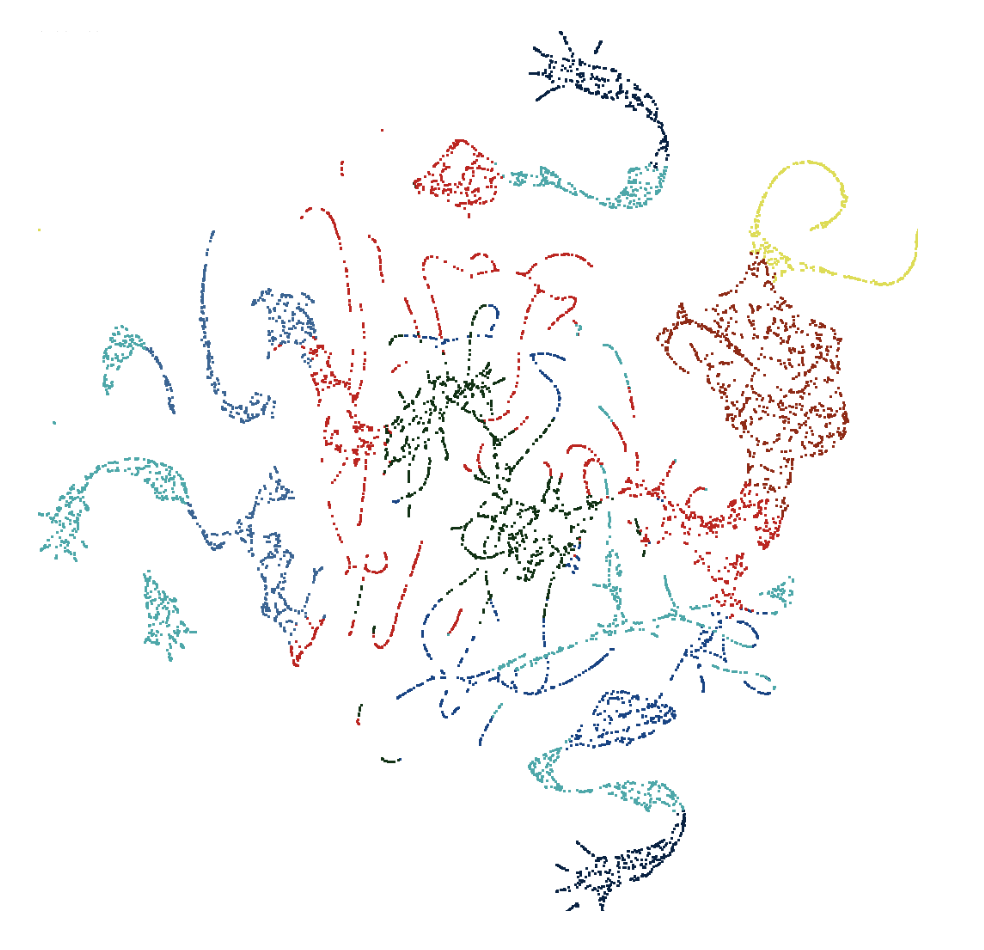
There has been a rapid uptake in the use of non-linear dimensionality reduction (NLDR) methods such as t-distributed stochastic neighbour embedding (t-SNE) in the natural sciences as part of cluster orientation and dimension reduction workflows. The appropriate use of these methods is made difficult by their complex parameterisations and the multitude of decisions required to balance the preservation of local and global structure in the resulting visualisation. We present visual diagnostics for the pragmatic usage of NLDR methods by combining them with a technique called the tour.
Read more →

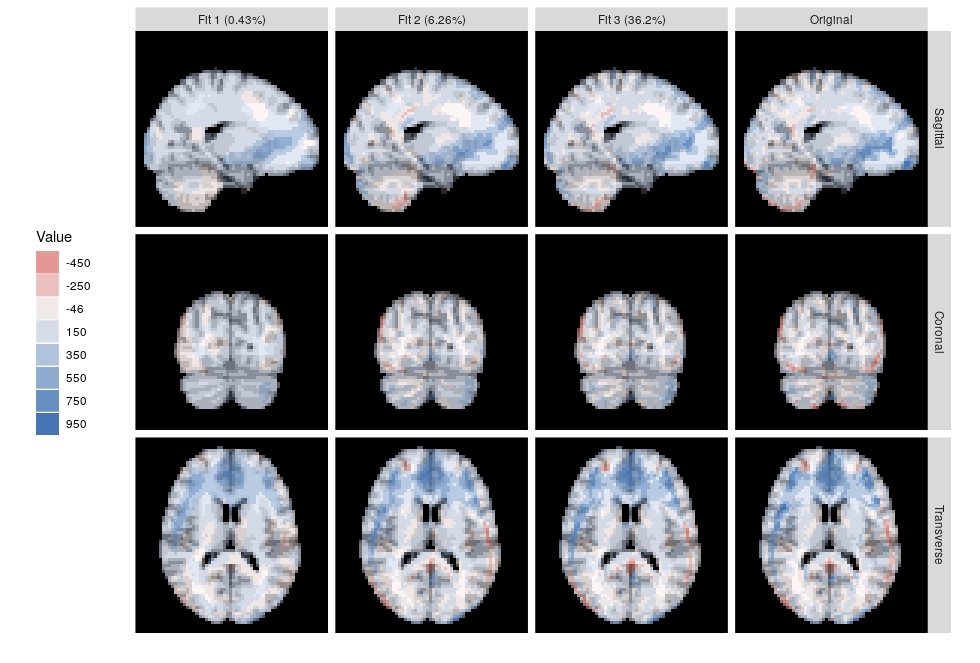
Tensor decompositions are used for pattern recognition, exploratory data analysis, dimension reduction, and visualization of tensor-valued data. In this talk, I will review the theory, computation and visualization of the Higher-Order Orthogonal Iteration (HOOI), which is a higher-order generalization of the matrix-valued SVD. I will use a sample of resting state fMRI, and the ggbrain R package to help visualize the decomposition.
Read more →

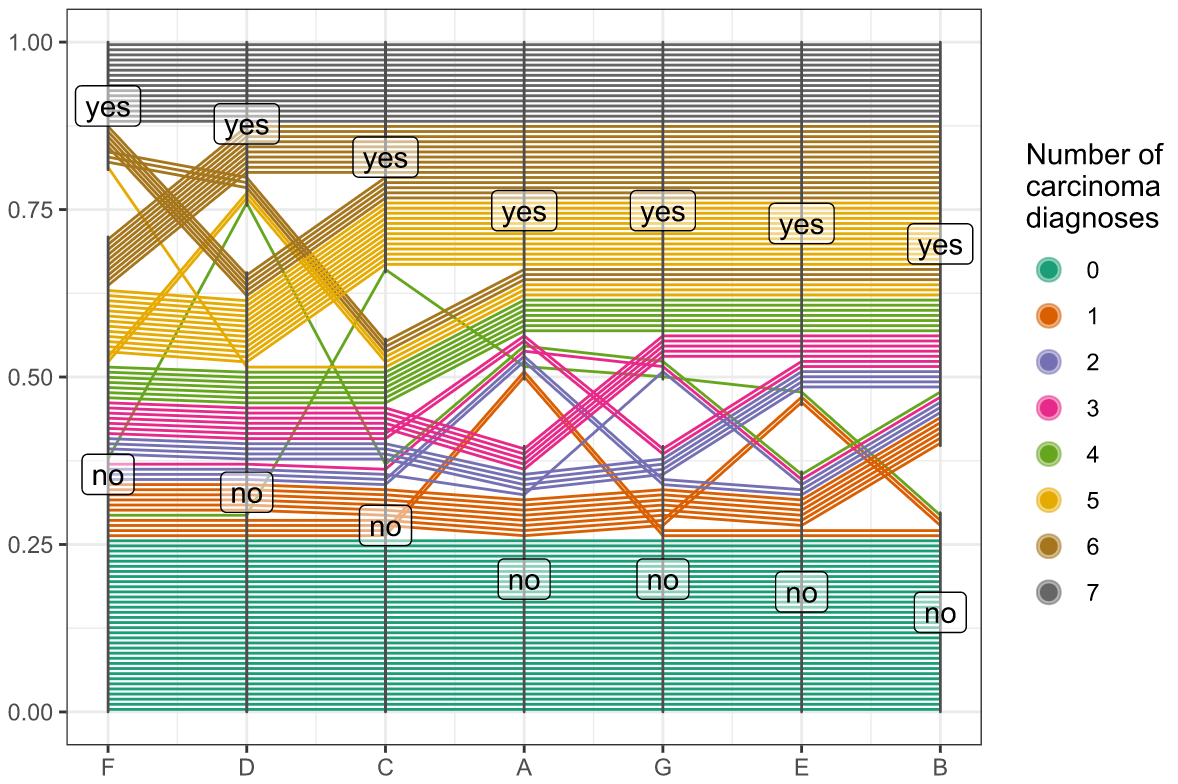
ggpcp is an R package developed for the generalized parallel coordinate plots which are a useful set of graphics for visualizing data with more than 2-dimensions. It is generalized in the sense of combining numeric and categorical variables together while keeping the ability to track each observation. It helps to see some interesting aspects of the “high”-dimensional data.
Read more →

Taking projections of high-dimensional data is a common analytical and visualisation technique in statistics for working with high-dimensional problems. Sectioning, or slicing, through high dimensions is less common, but can be useful for visualising data with concavities, or non-linear structure. It is associated with conditional distributions in statistics, and also linked brushing between plots in interactive data visualisation. This talk will describe the simple approach for slicing in the orthogonal space of projections obtained when running a tour, thus presenting the viewer with an interpolated sequence of sliced projections.
Read more →

One of our fundamental tasks as data scientists, especially given our focus on statistical graphics, is to take a potentially large and messy dataset, and extract meaningful relationships and patterns from it. One such approach to this is dimension reduction, the task of reducing the number of variables in a dataset to a much smaller number that still captures the structure of the original data well. A commonly used technique for dimension reduction is PCA, or Principal Component Analysis, where transformations of the variables are made in order to extract a set of uncorrelated principal components from the data.
Read more →


