Nitrogen (N) must be managed efficiently to reach profitability while limiting N losses to the environment. The late-season corn stalk nitrate test (CSNT) is a reliable evaluation tool for measuring corn N status and understanding of how N management practices perform at the field scale. The CSNT measures the nitrate (NO3−) concentration in the above-ground portion of cornstalks, which can be collected up to three weeks after black layer formation. Numeric results are usually interpreted into four N sufficiency categories: deficient, marginal, optimal, and excessive.
Read more →

Past studies - Subjective Judgment in Statistical Analysis: An Experimental Study (D.J. Finney; 1951) and Eye Fitting Straight Lines (Mosteller et. al. 1981) - conducted graphics experiments to evaluate human perception of fitting best fit lines by eye through a set of points or a given trend. We bring this experiment into the modern era with r2d3, following a similar process to NYTimes You Draw It pages. In previous research, we conducted a graphical experimental task using lineups and visual inference to evaluate whether our ability to perceptually notice differences in exponentially increasing trends is impacted by the choice of scale.
Read more →

Interactive data visualization is a powerful visual format that allows users to experience and explore data and their patterns. One of the most popular tools for creating interactive data visualizations is the D3.js library. The r2d3 package in R provides an entry point for R users to utilize the D3 graphing library to create beautiful interactive visualizations. In this talk I will introduce the basics of D3 and the functionality behind the r2d3 package, and demonstrate how R and ggplot2 users can start learning how to use D3 for interactive visualizations.
Read more →

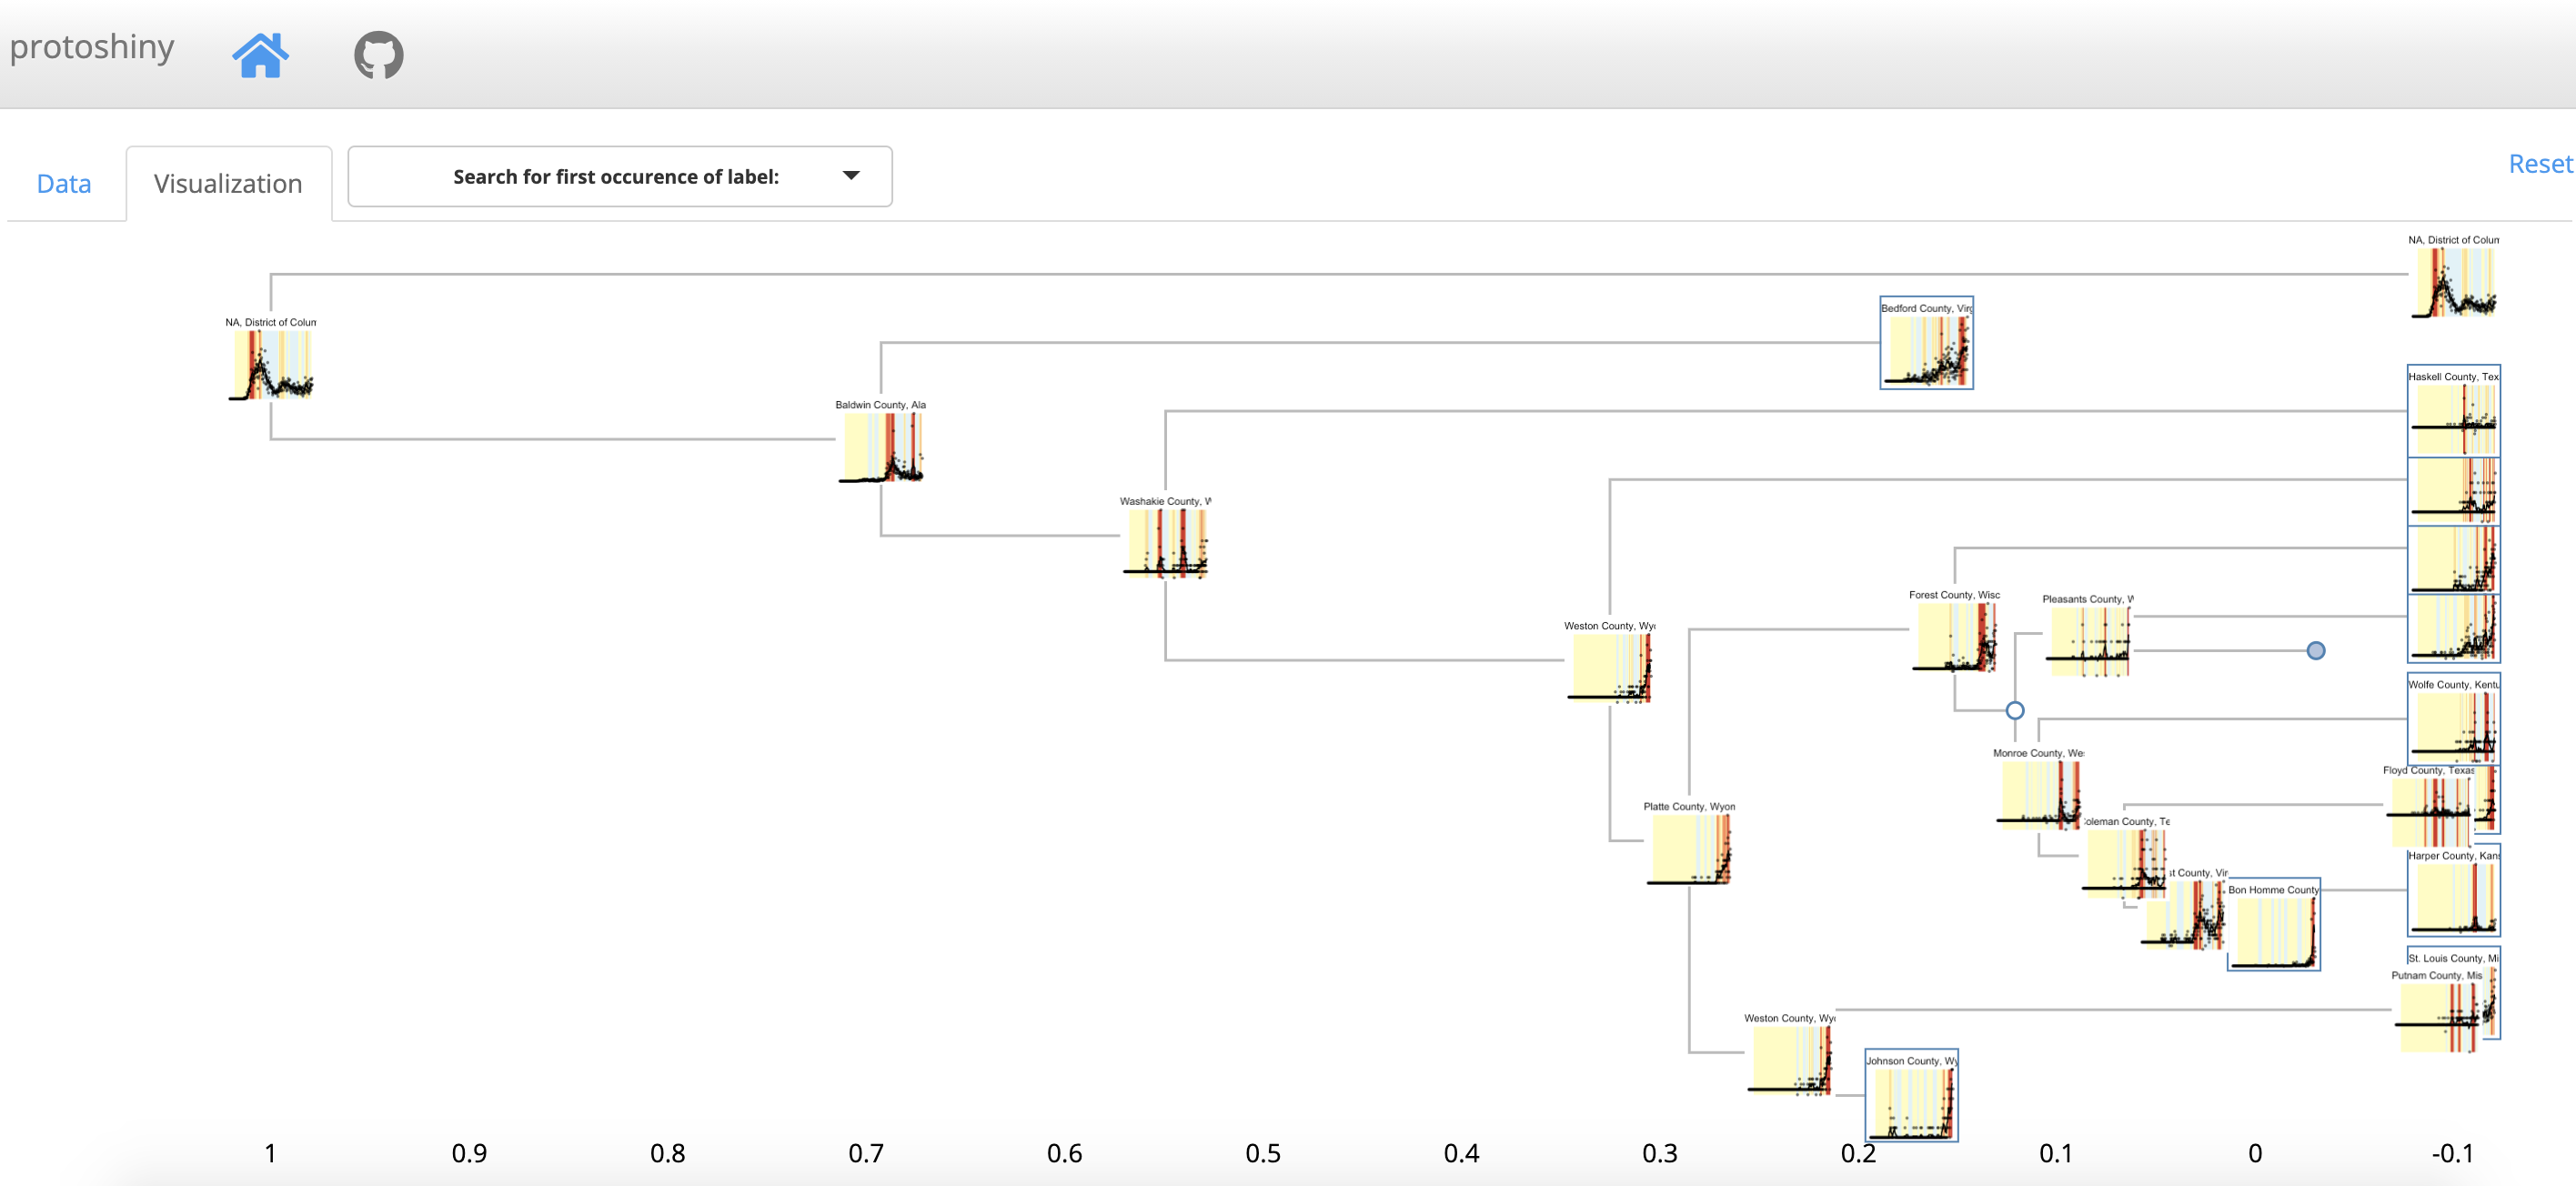
Clustering is one of the principal tools used by data analysts for uncovering the structure present within a data set. Hierarchical clustering is particularly popular since it can reveal multiple scales of groupings at once without forcing the data analyst to commit to a certain number of clusterings. However, hierarchical clustering’s usefulness as a visualization tool is severely degraded by increasing data set sizes. We present an interactive tool that overcomes this difficulty, making hierarchical clustering useful for exploring data sets at scales of interest.
Read more →


