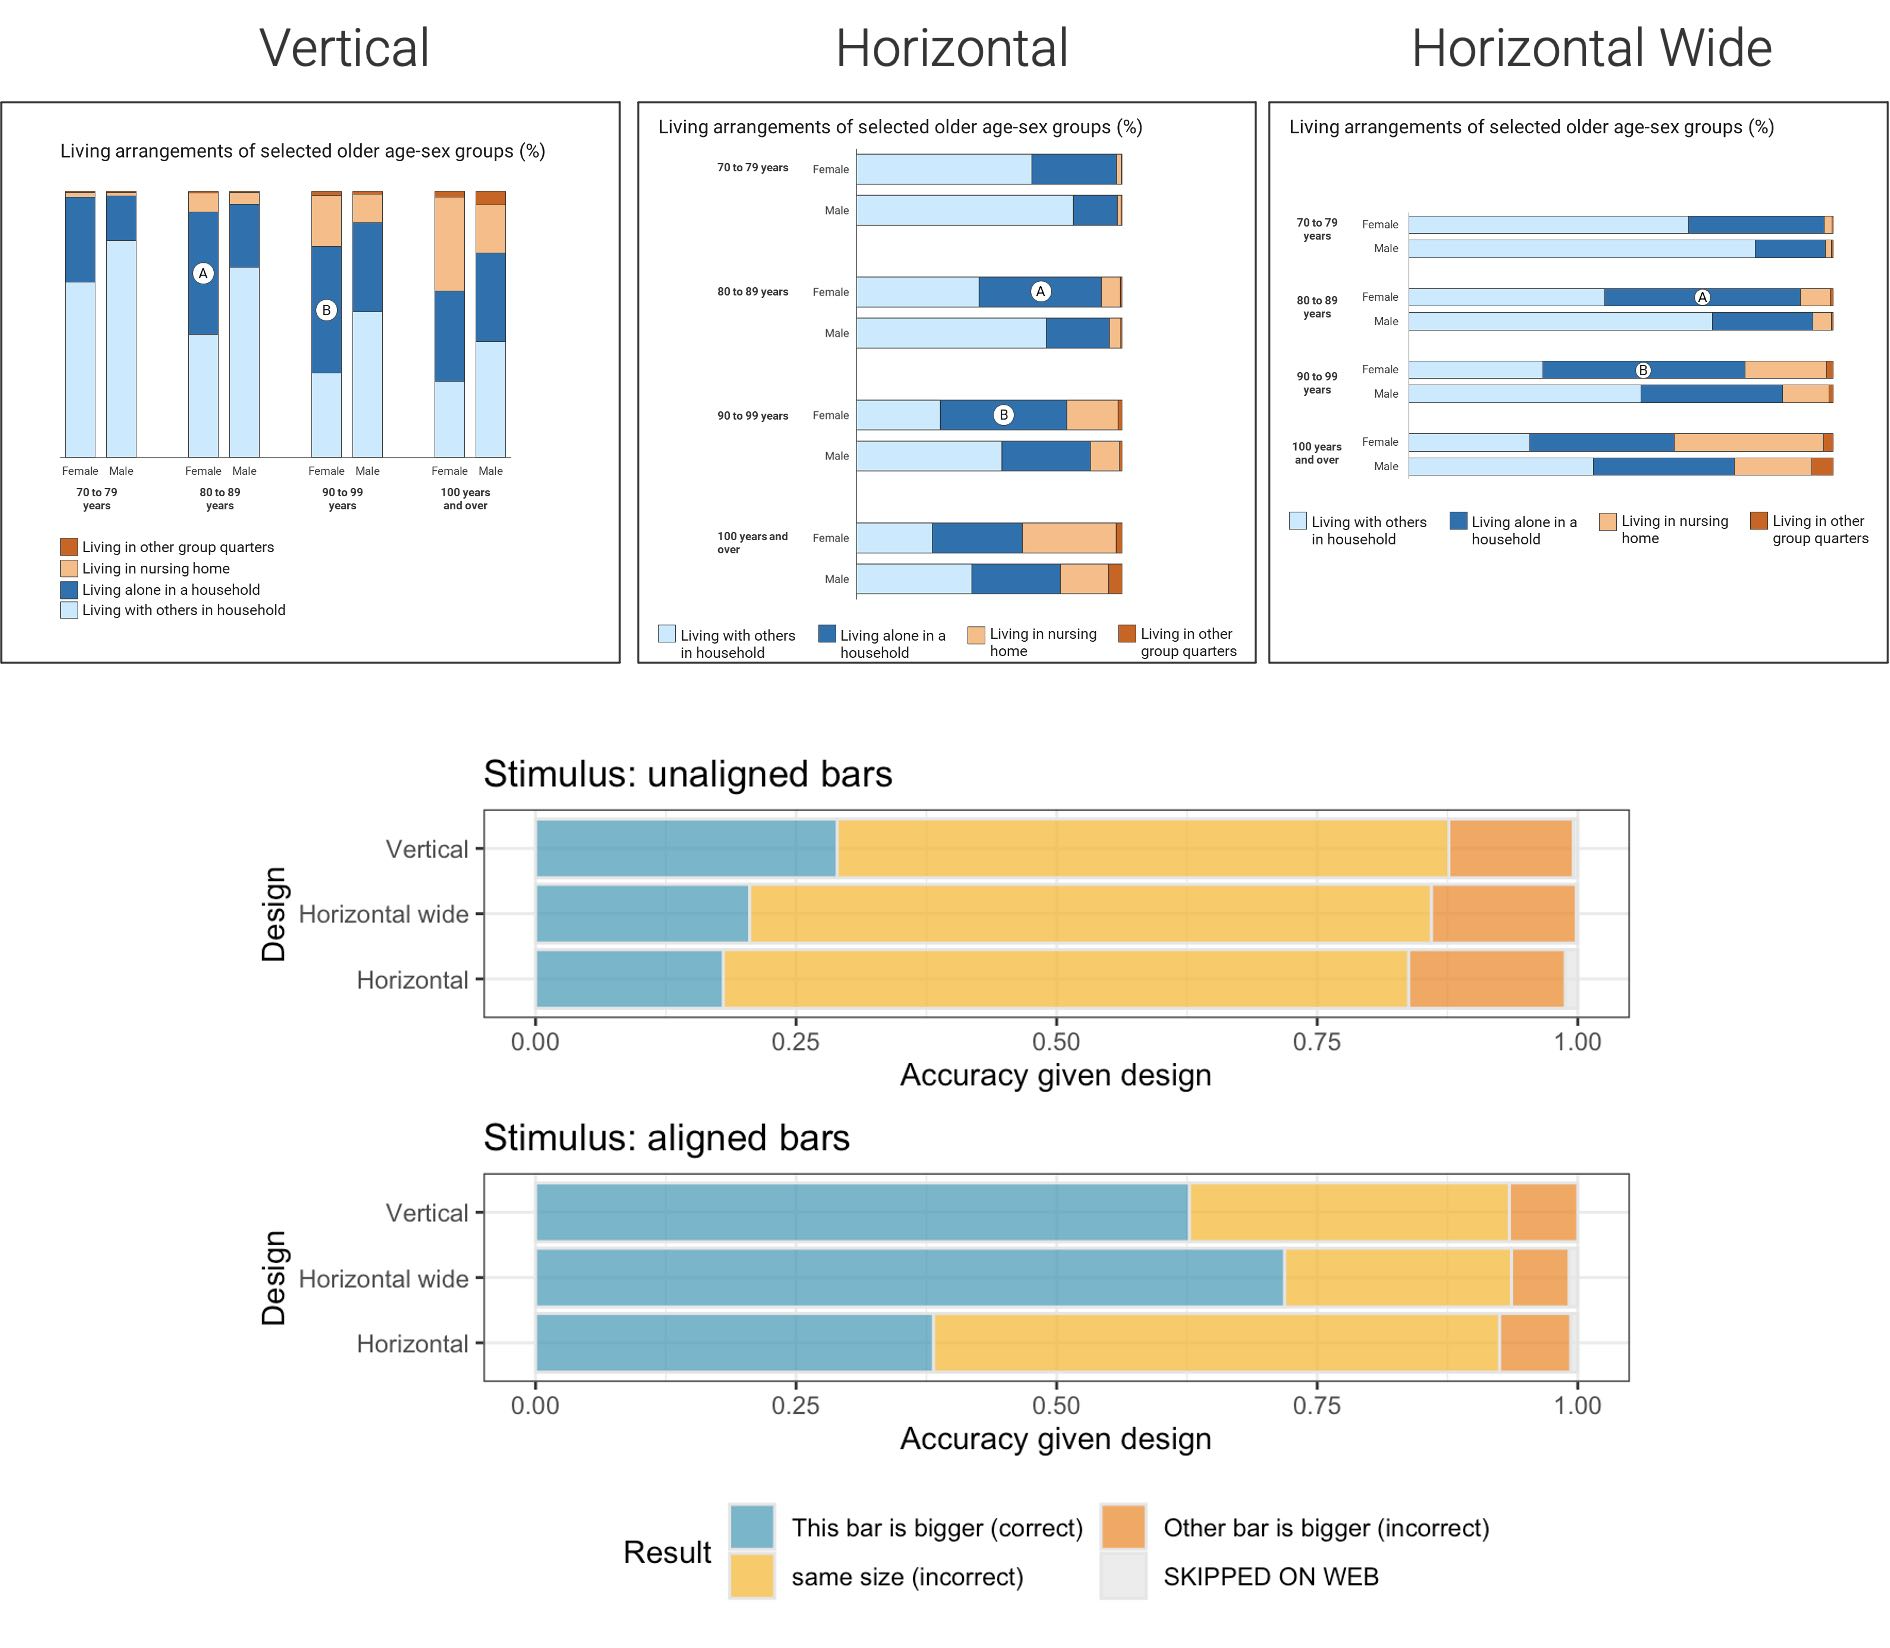
The creation of a data visualization depends on both analytic design and graphic design. Analytic designs focus on the structure of a chart and how data are encoded onto structural pieces such as length, area, and angle. Graphic design focuses on the use of supporting visual elements such as colors, patterns, and supporting context. Our work tests how viewers interact with three elements of modern data visualization: structure, aesthetics, and interpretation.
Read more →
When working on a project, sometimes it is necessary to use different programming languages to accomplish a task. The Reticulate Package in R creates a R interface to Python, allowing for R and Python to be used smoothly with each other. This presentation will give a brief overview of the Reticulate Package. As an example of the use of this package, I will present a Shiny application that I have been developing, and the steps I took in order to get Python working within the app.
Read more →
If you have built a Shiny app, you have some familiarity with the concept of reactivity. For the next two graphics-groups, we’ll talk about two alternatives to Shiny which also use reactivity:
Dash, using Python Observable, using JavaScript As examples, we’ll talk about how you can build the “same” app using all three tools. For the first session, we’ll discuss Shiny and Dash.
Here’s a reference I’m working on: https://ijlyttle.
Read more →
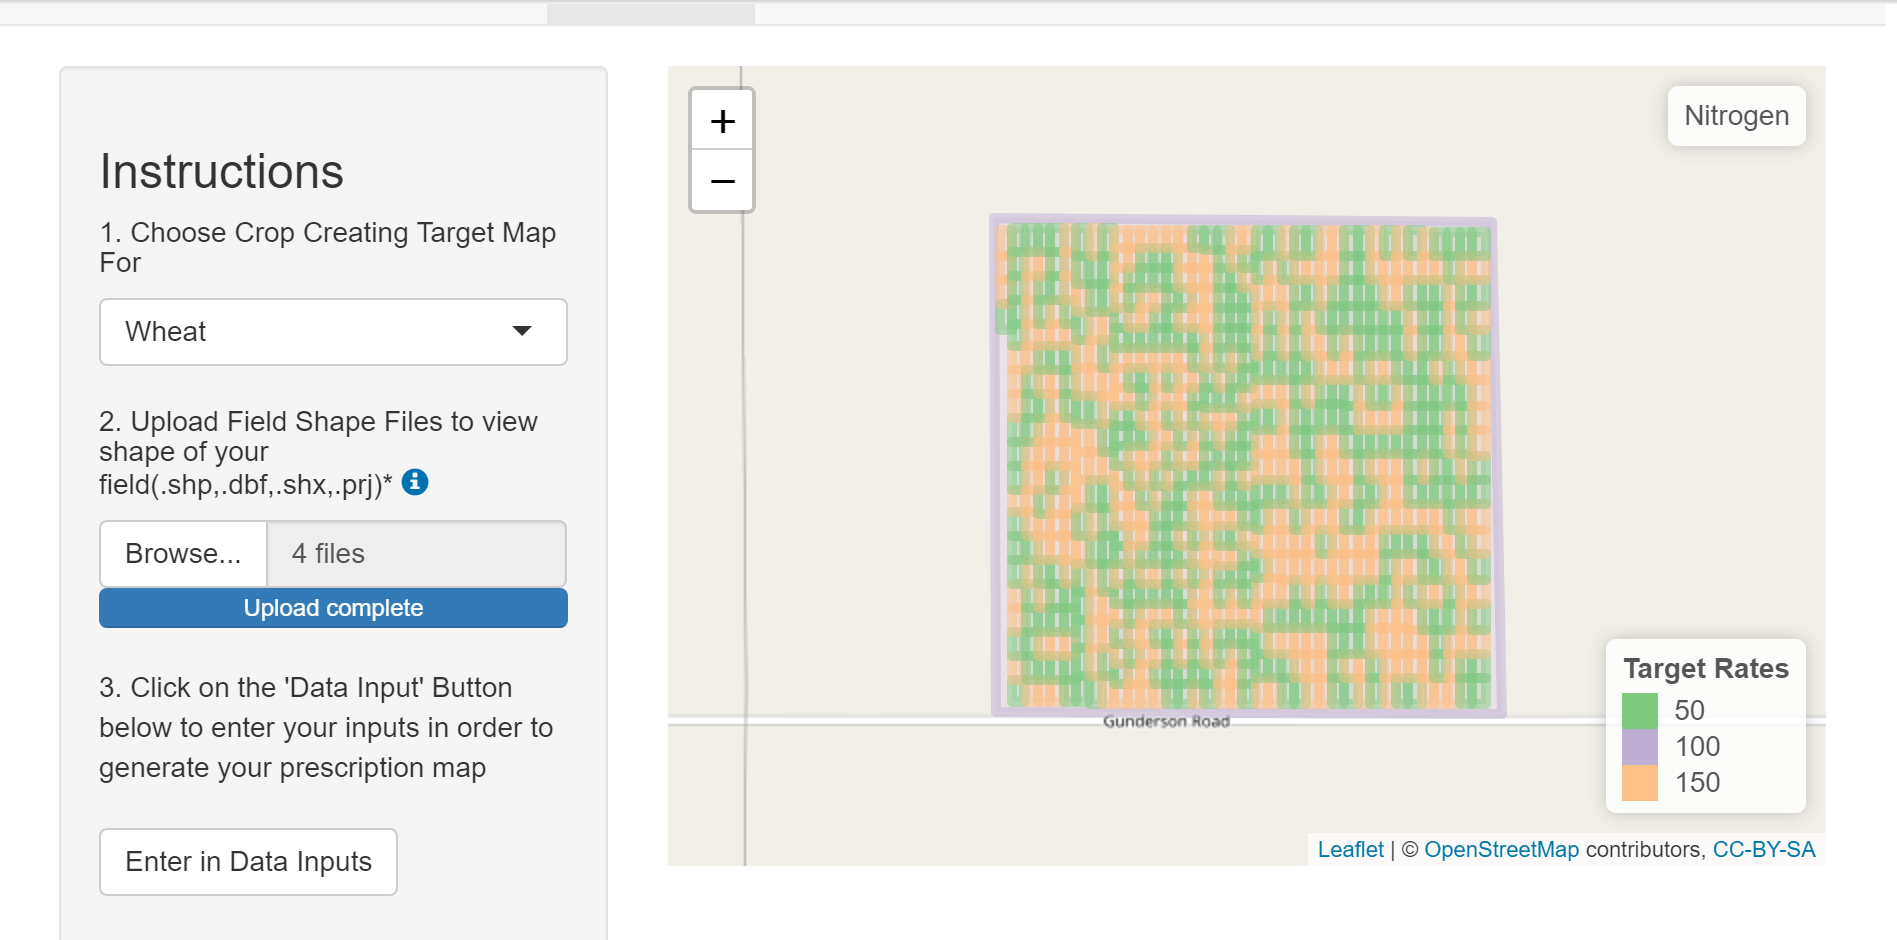
Many small and rural places are shrinking. Interactive dashboards are the most common use cases for data visualization and context for exploratory data tools. In our paper, we will explore the specific scope of how dashboards are used in small and rural areas to empower novice analysts to make data-driven decisions. Our framework will suggest a number of research directions to better support small and rural places from shrinking using an interactive dashboard design, implementation, and use for the everyday analyst.
Read more →
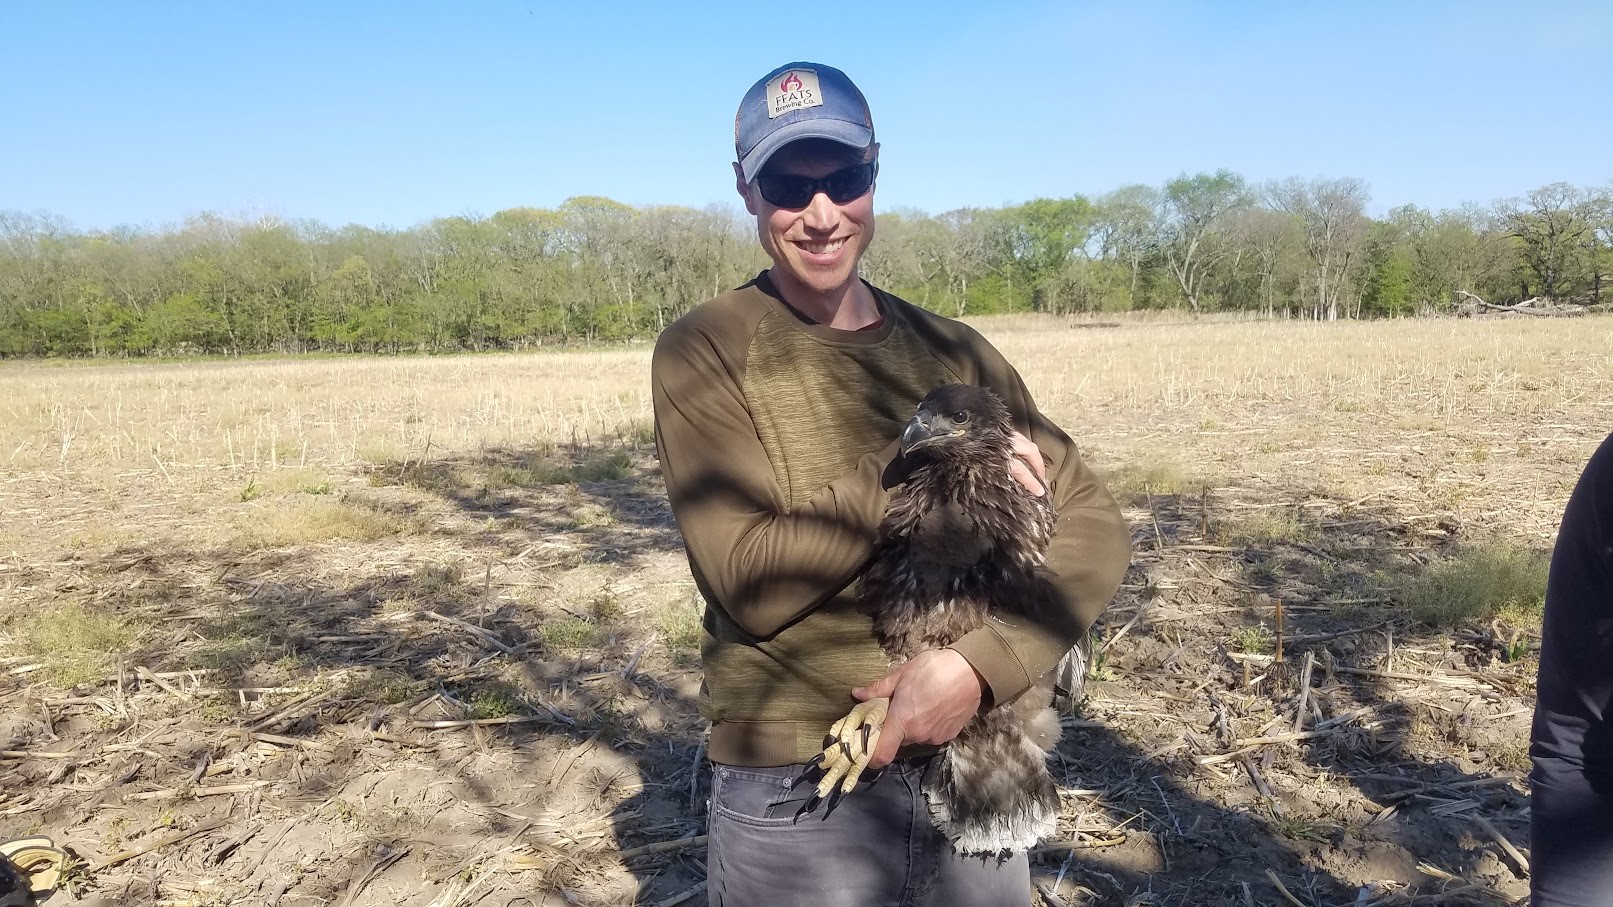
In this talk I describe a collaboration with research wildlife biologists and statisticians to analyze over 2 million data points collected from GPS telemetry devices attached to bald eagles. My research project involved two phases: unsupervised learning, and supervised learning. The intent of this project was to understand land types where bald eagles might be at greater risk of collision with industrial wind turbines to inform placement of wind farms.
Read more →