This is a discussion of color spaces, optimizing color ranges for aesthetics, light and dark mode, while establishing accessibility and the associated compromises we have to make.
Read more →

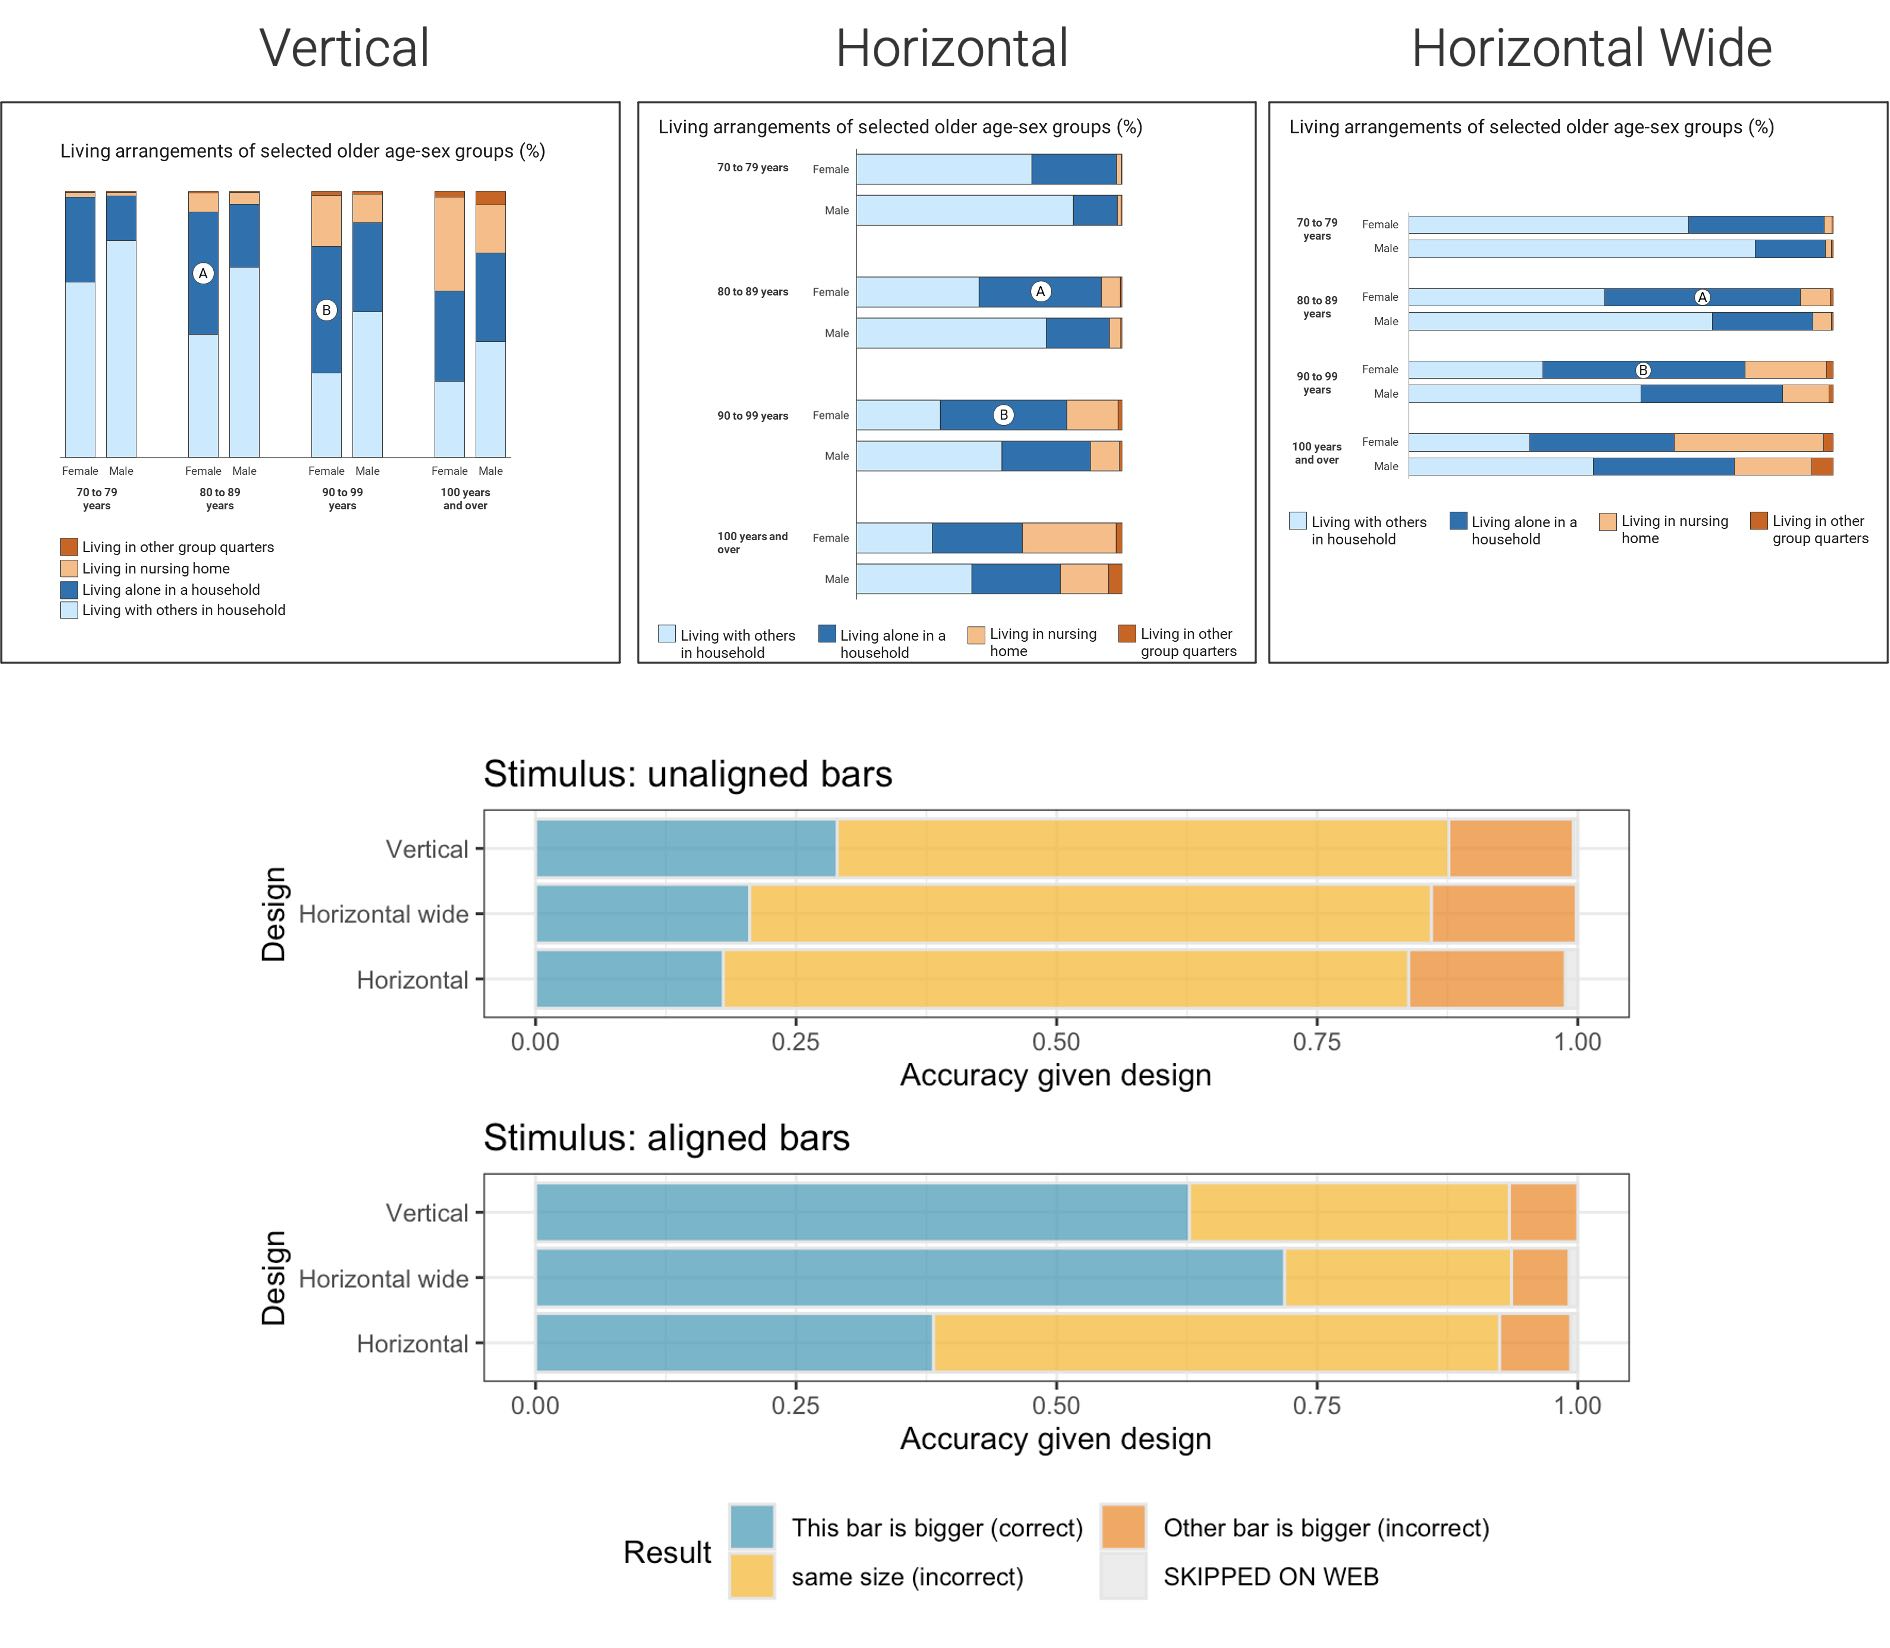
The creation of a data visualization depends on both analytic design and graphic design. Analytic designs focus on the structure of a chart and how data are encoded onto structural pieces such as length, area, and angle. Graphic design focuses on the use of supporting visual elements such as colors, patterns, and supporting context. Our work tests how viewers interact with three elements of modern data visualization: structure, aesthetics, and interpretation.
Read more →


