Past studies - Subjective Judgment in Statistical Analysis: An Experimental Study (D.J. Finney; 1951) and Eye Fitting Straight Lines (Mosteller et. al. 1981) - conducted graphics experiments to evaluate human perception of fitting best fit lines by eye through a set of points or a given trend. We bring this experiment into the modern era with r2d3, following a similar process to NYTimes You Draw It pages. In previous research, we conducted a graphical experimental task using lineups and visual inference to evaluate whether our ability to perceptually notice differences in exponentially increasing trends is impacted by the choice of scale.
Read more →

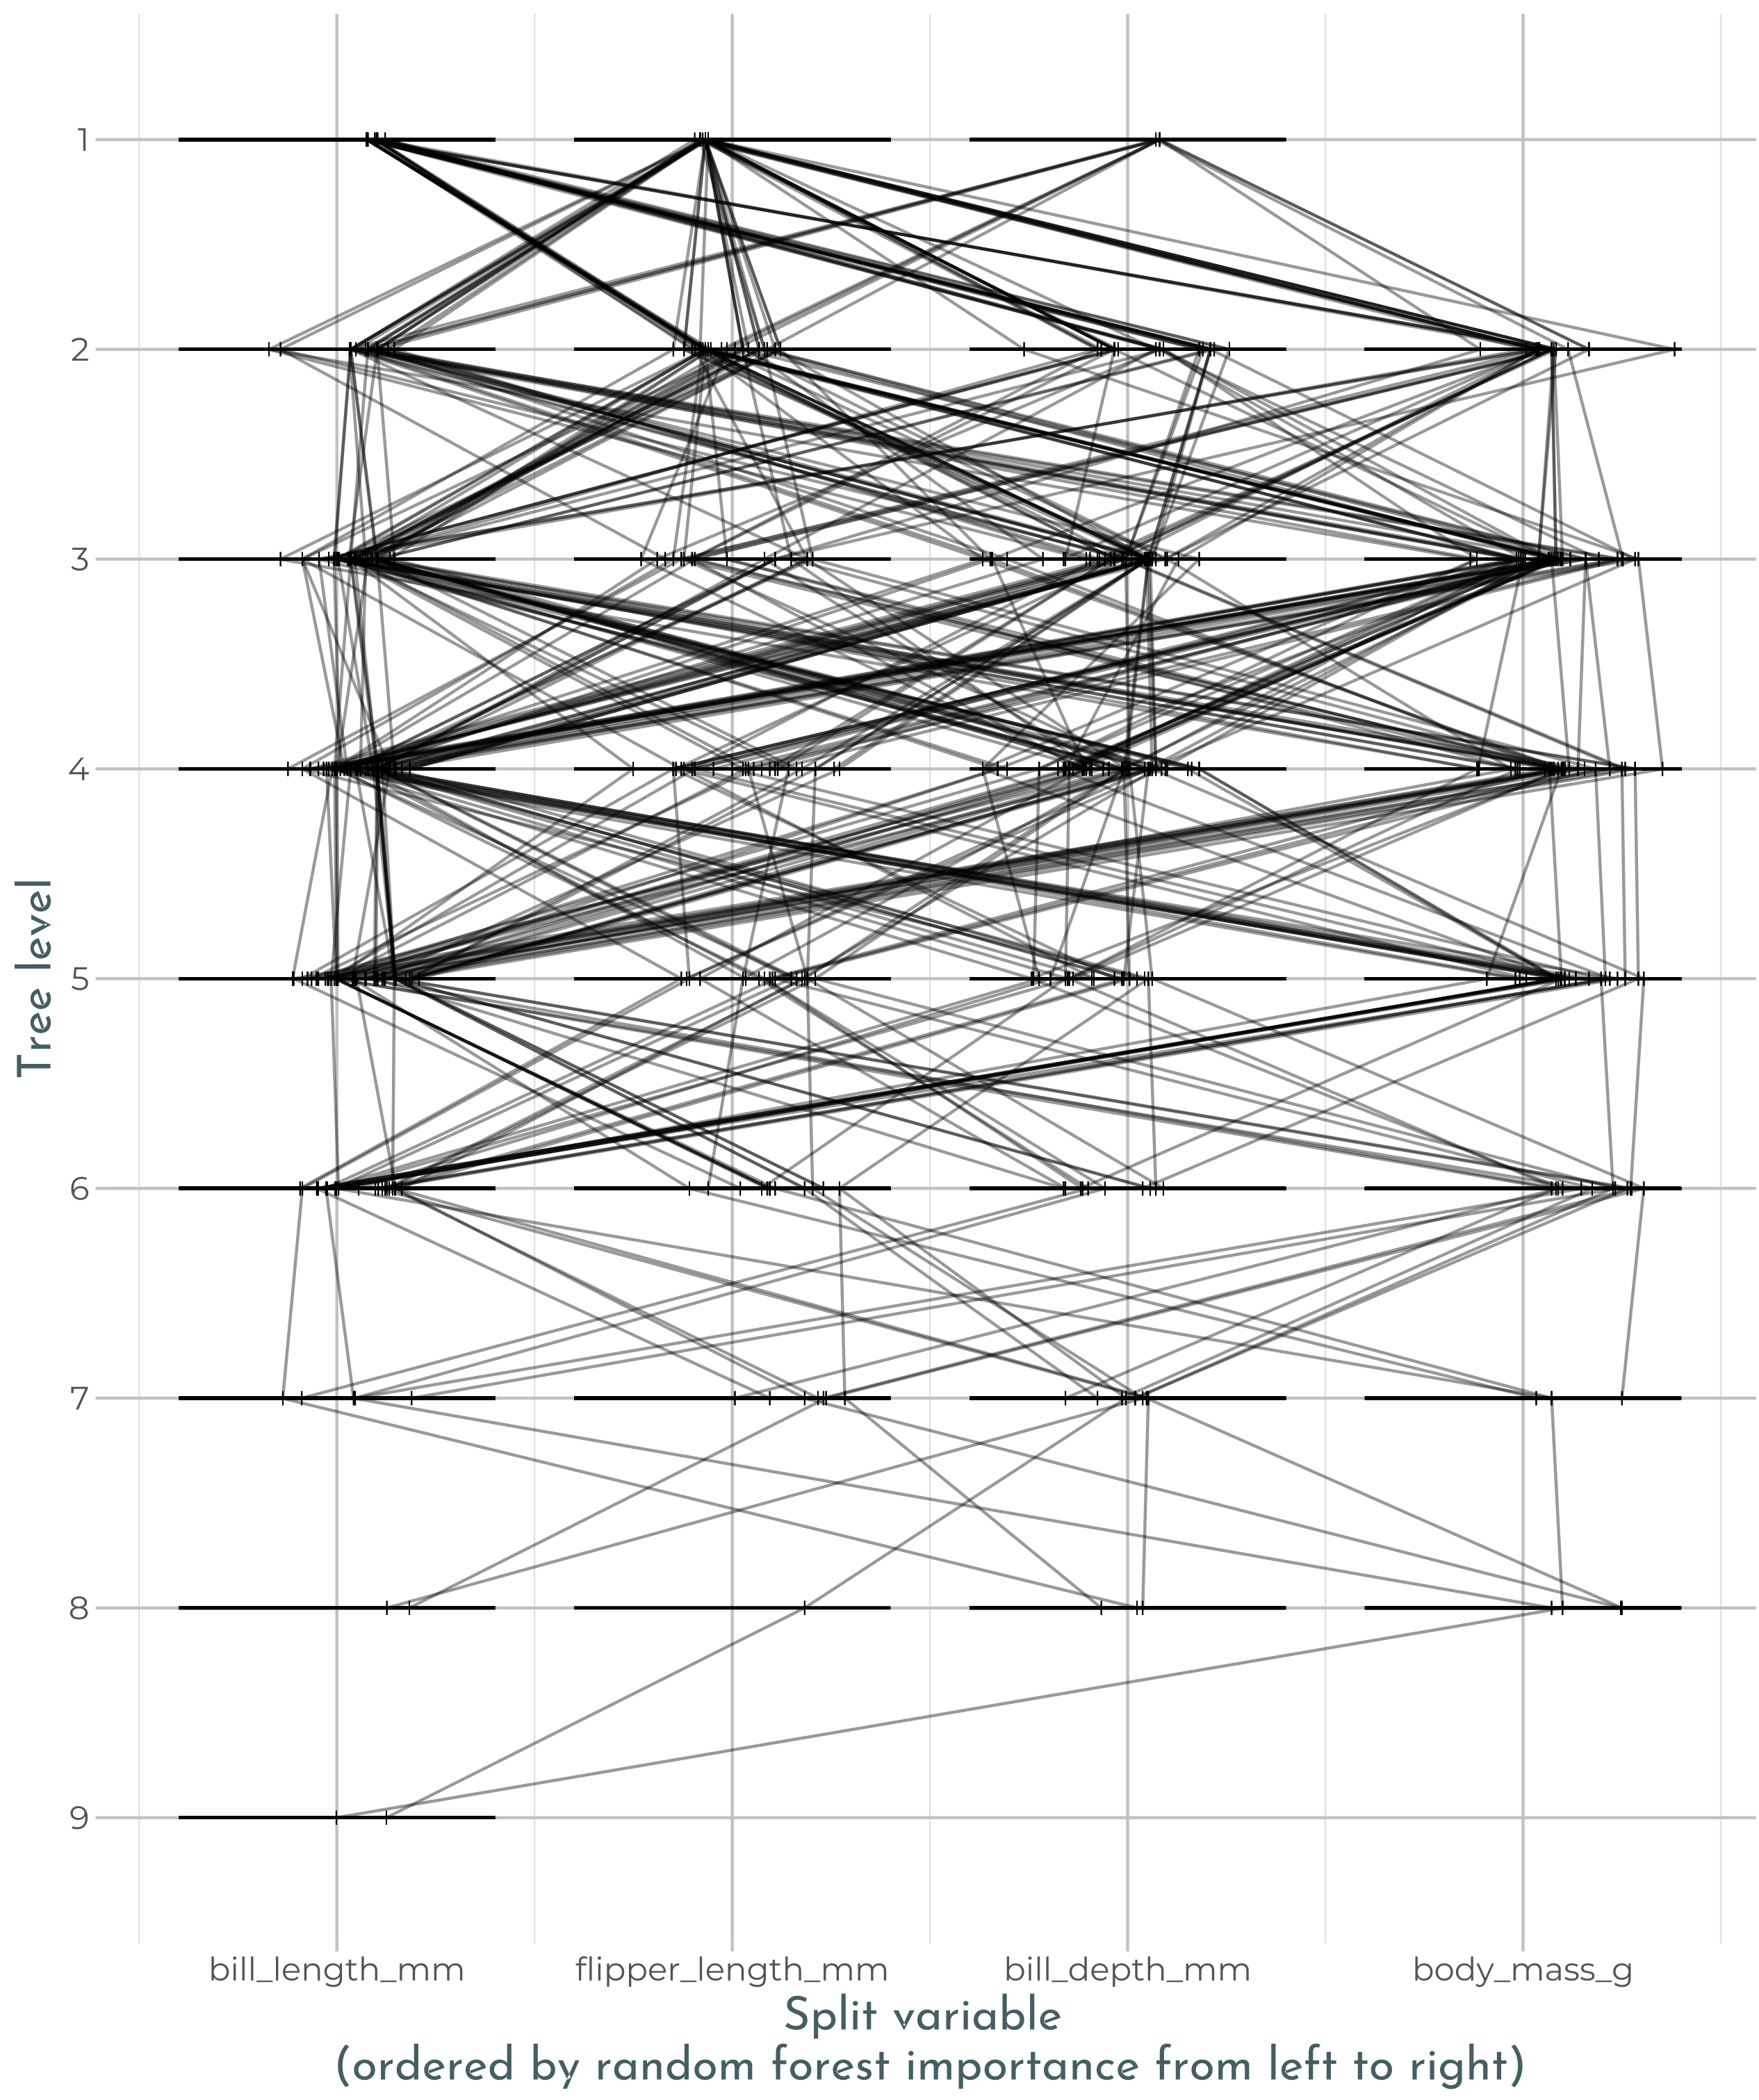
Random forests are a popular method for statistical applications with an objective of prediction. While an individual tree within a random forest provides a clear decision path for how a prediction is made, the ensemble of trees from the forest creates a complex decision process that is difficult to interpret. One approach used to gain insight into this decision process is visualization of the model. Various approaches have been taken to visualize random forests including trace plots developed by Simon Urbanek (https://link.
Read more →

Interactive data visualization is a powerful visual format that allows users to experience and explore data and their patterns. One of the most popular tools for creating interactive data visualizations is the D3.js library. The r2d3 package in R provides an entry point for R users to utilize the D3 graphing library to create beautiful interactive visualizations. In this talk I will introduce the basics of D3 and the functionality behind the r2d3 package, and demonstrate how R and ggplot2 users can start learning how to use D3 for interactive visualizations.
Read more →

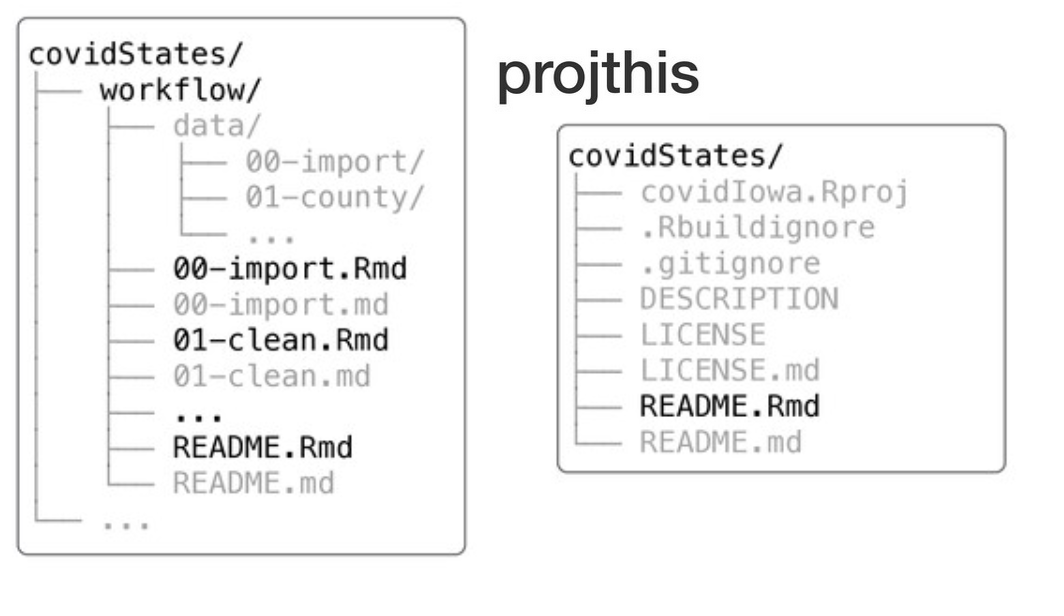
projthis is a new R-package, which offers a framework for analysis-based project workflows. You can use it to: (1) manage the dependencies among files in your workflows; projthis provides tools to support a directory structure and a naming convention. (2) manage your project’s package-dependencies; projthis helps you use a DESCRIPTION file. (3) automate the rendering of your workflow using GitHub Actions; projthis provides a template for an Action.
Here’s a couple examples of analysis projects built and automated (run daily) using projthis: covidStates, and covidIowa.
Read more →
Leveraging a variety of APIs and scraping methods, we assembled data from many different publicly available data sources, including local, state, and national government data. Combining this data (which is collected at many different spatial resolutions), we explore the factors contributing to quality of life in small towns in Iowa, using both supervised and unsupervised methods to identify clusters of similar towns. Working with stakeholders in the small towns, we create visualizations designed to give small towns access to their own data, helping them to make decisions which preserve quality of life amid shrinking population.
Read more →


