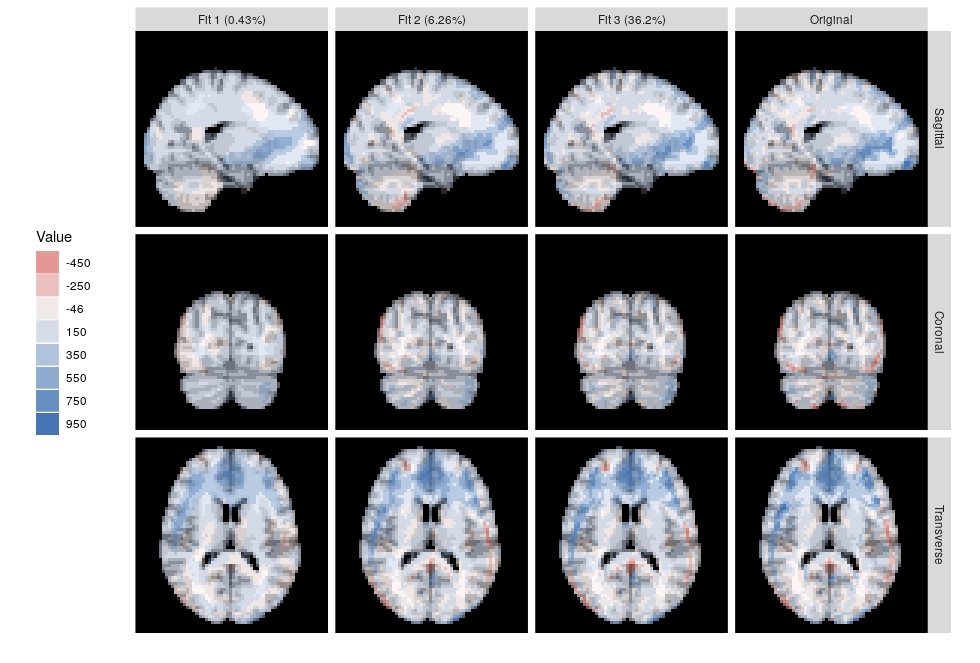
Tensor decompositions are used for pattern recognition, exploratory data analysis, dimension reduction, and visualization of tensor-valued data. In this talk, I will review the theory, computation and visualization of the Higher-Order Orthogonal Iteration (HOOI), which is a higher-order generalization of the matrix-valued SVD. I will use a sample of resting state fMRI, and the ggbrain R package to help visualize the decomposition.
Read more →
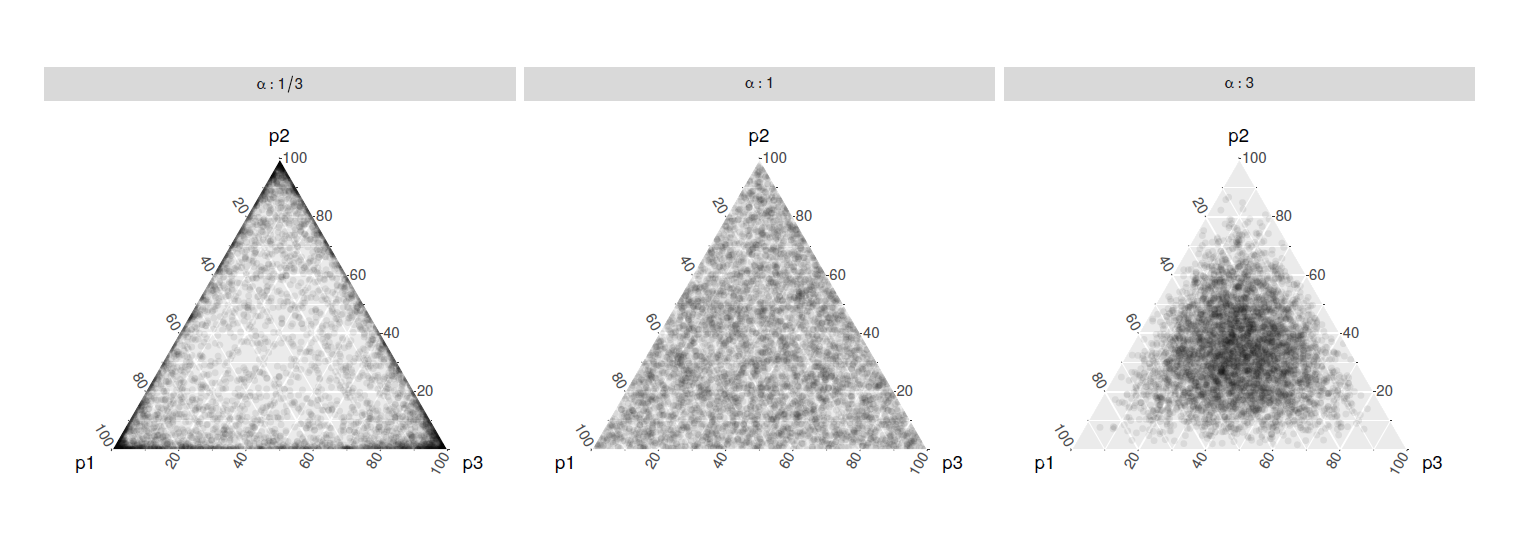
Statistical inference provides the protocols for conducting rigorous science, but data plots provide the opportunity to discover the unexpected. These disparate endeavors are bridged by visual inference, where a lineup protocol can be employed for statistical testing. Human observers are needed to assess the lineups, typically using a crowd-sourcing service. This paper describes a new approach for computing statistical significance associated with the results from applying a lineup protocol. It utilizes a Dirichlet distribution to accommodate different levels of visual interest in individual null panels.
Read more →
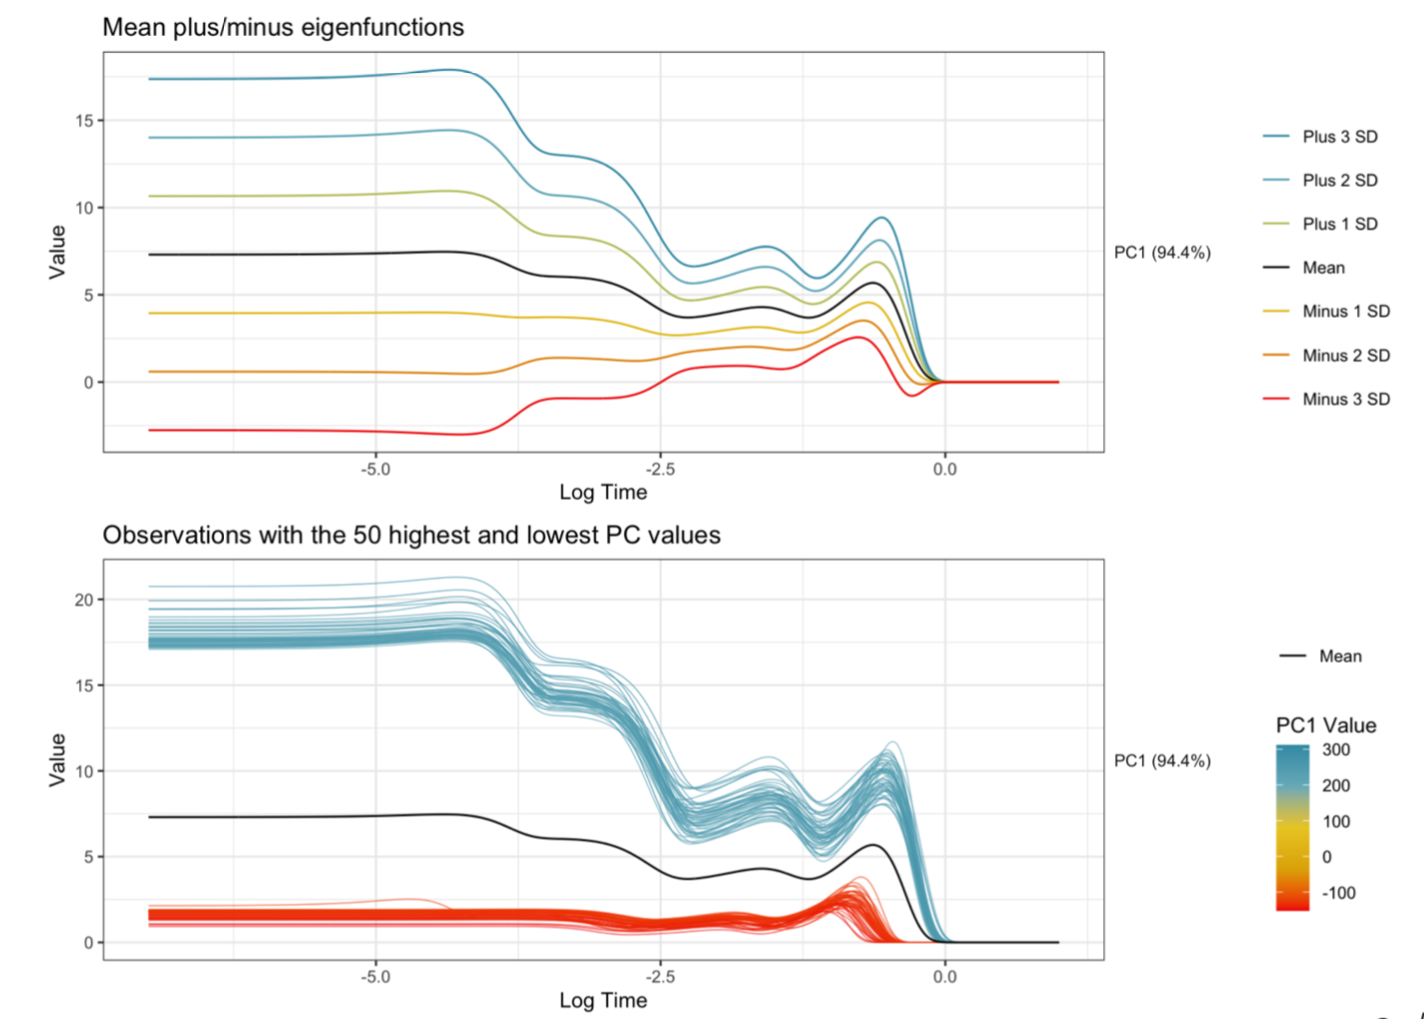
Explainable machine learning has become a quickly growing area of research as the use of black-box models continues to increase. While many methods have been proposed, little research has been done relating to applications involving functional data. As an intern at Sandia National Laboratories, I have been helping to develop methods to provide explanations for an application focused on predicting explosive device characteristics using optical spectral-temporal signatures from explosions. In this talk, I’ll discuss our approach that involves transforming the functions using functional principal component analysis, training neural networks on the functional principal components, and using permutation feature importance (PFI) to identify the principal components that are important for prediction.
Read more →
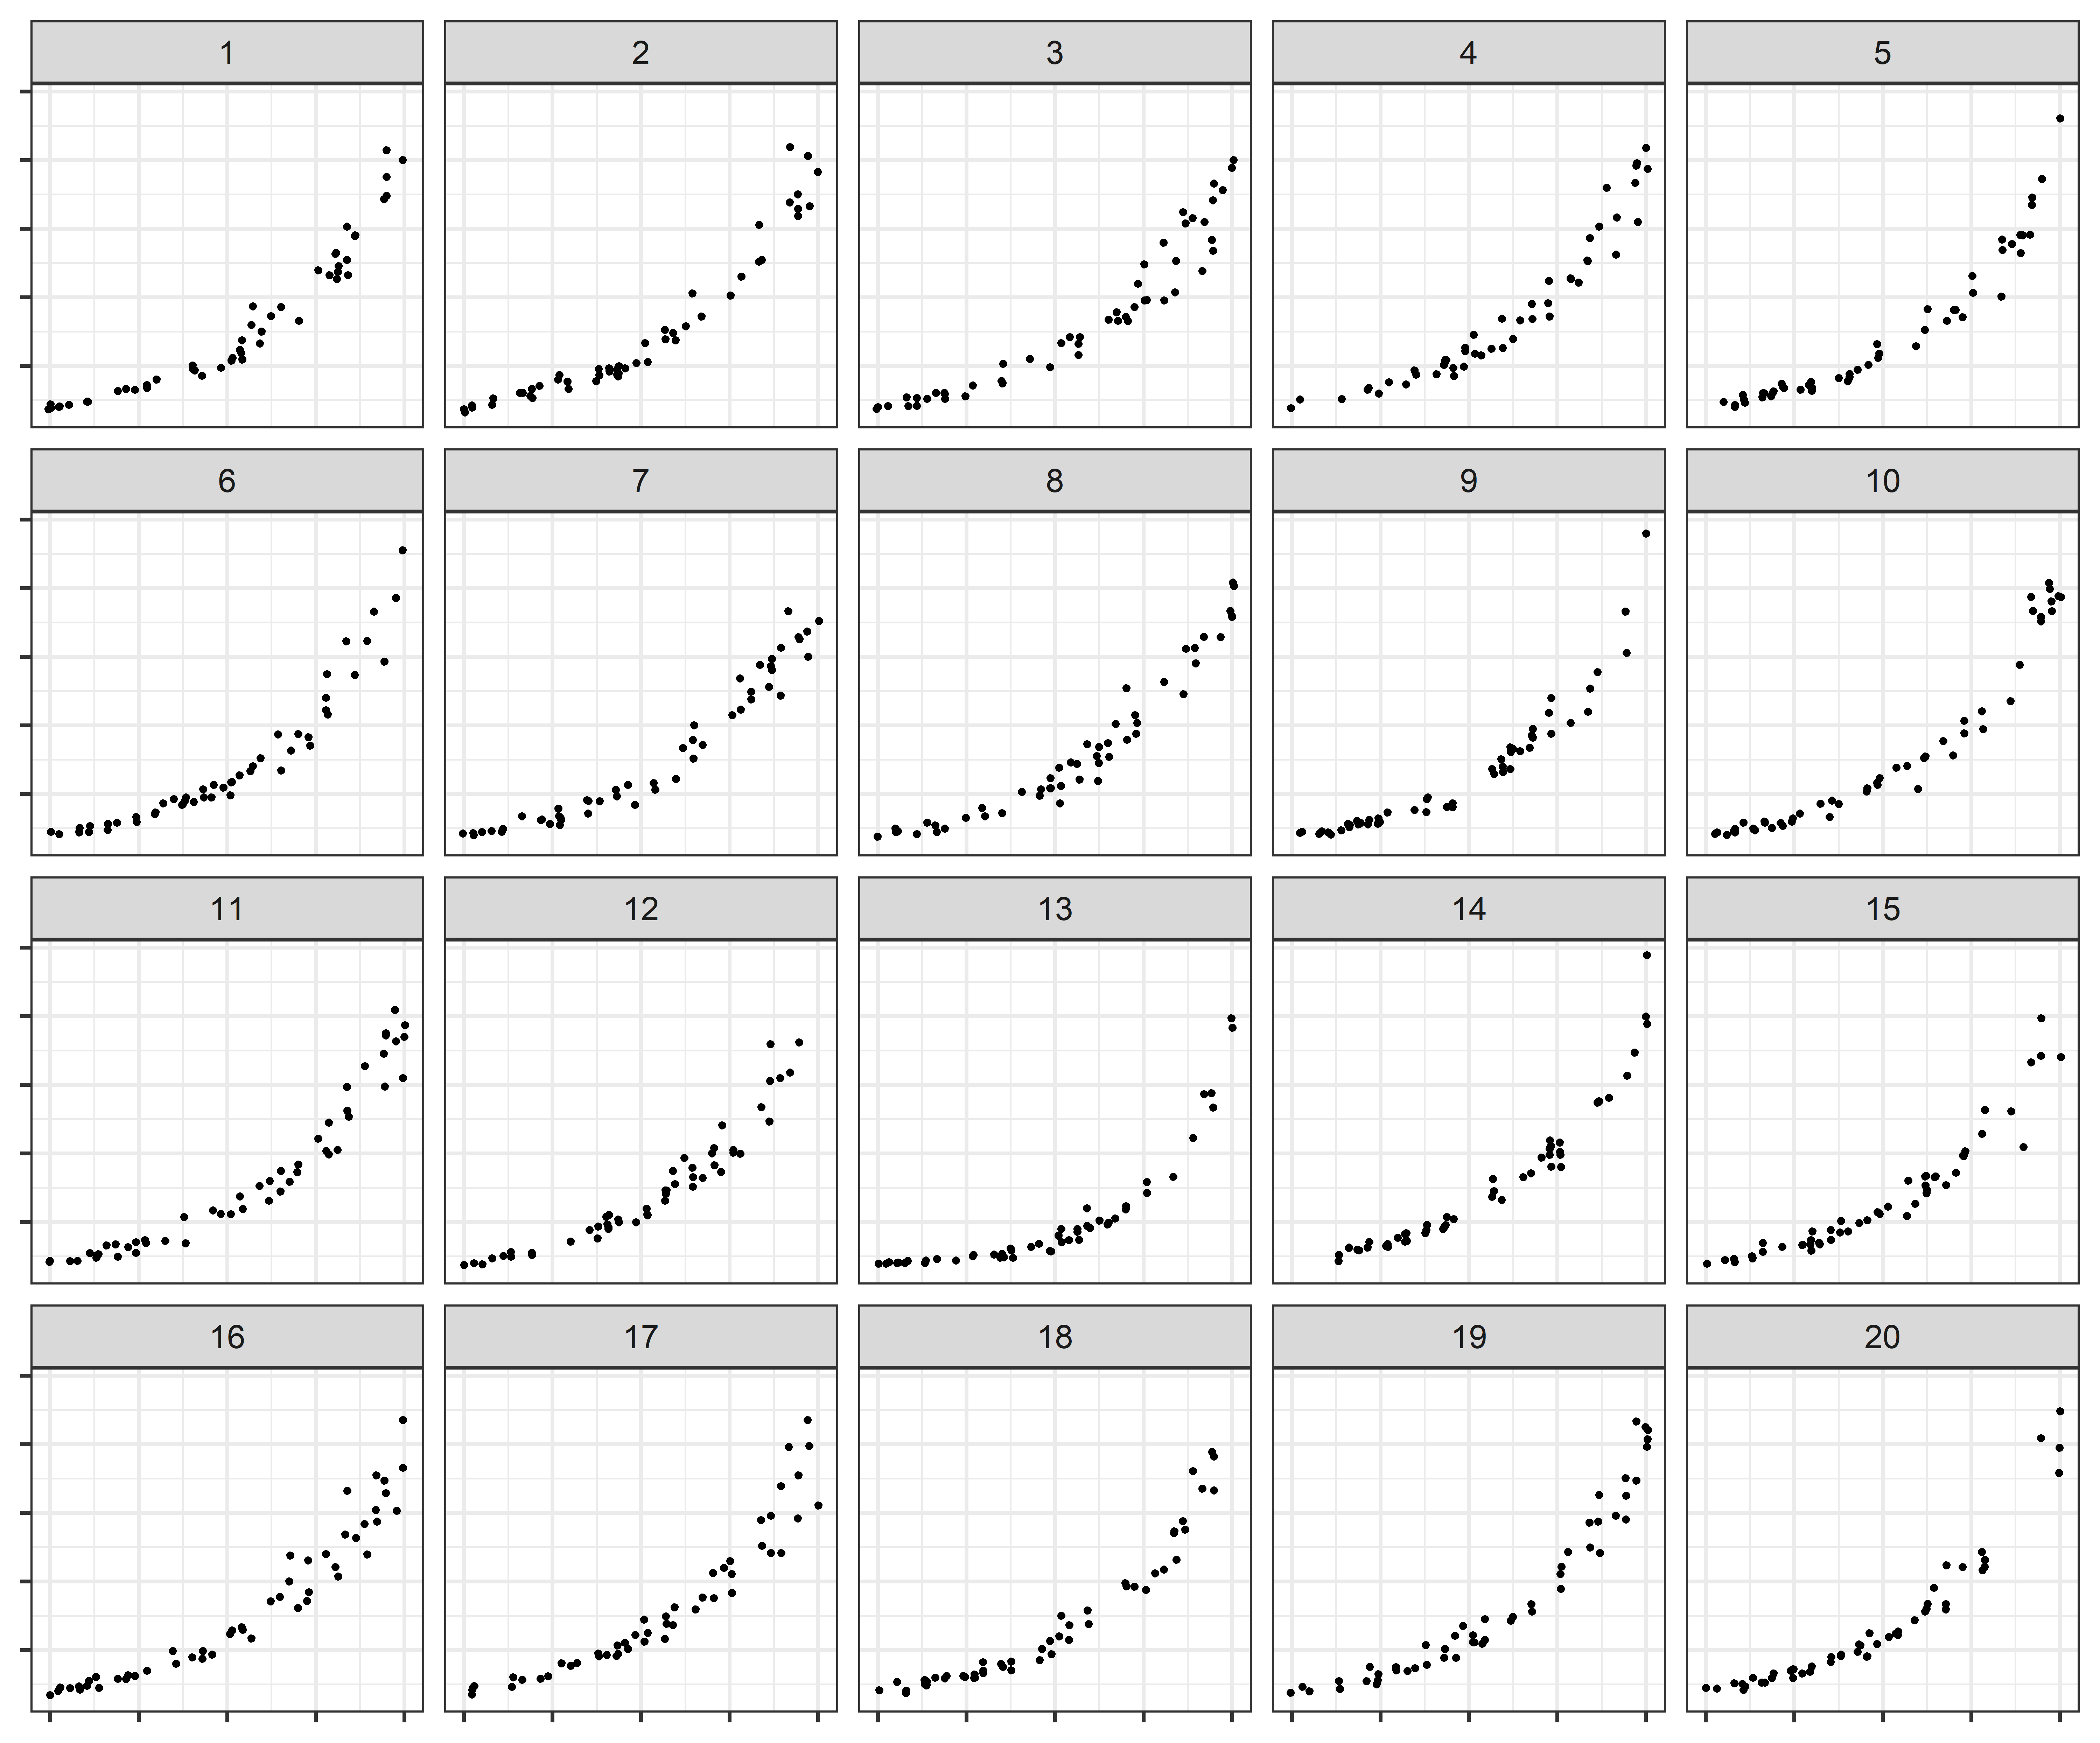
Log scales are often used to display data over several orders of magnitude within one graph. During the COVID pandemic, we’ve seen both the benefits and the pitfalls of using log scales to display data. In this week’s graphics group, we will test out an experiment designed to assess perceptual and cognitive biases in graphical displays of exponentially increasing data.
Read more →
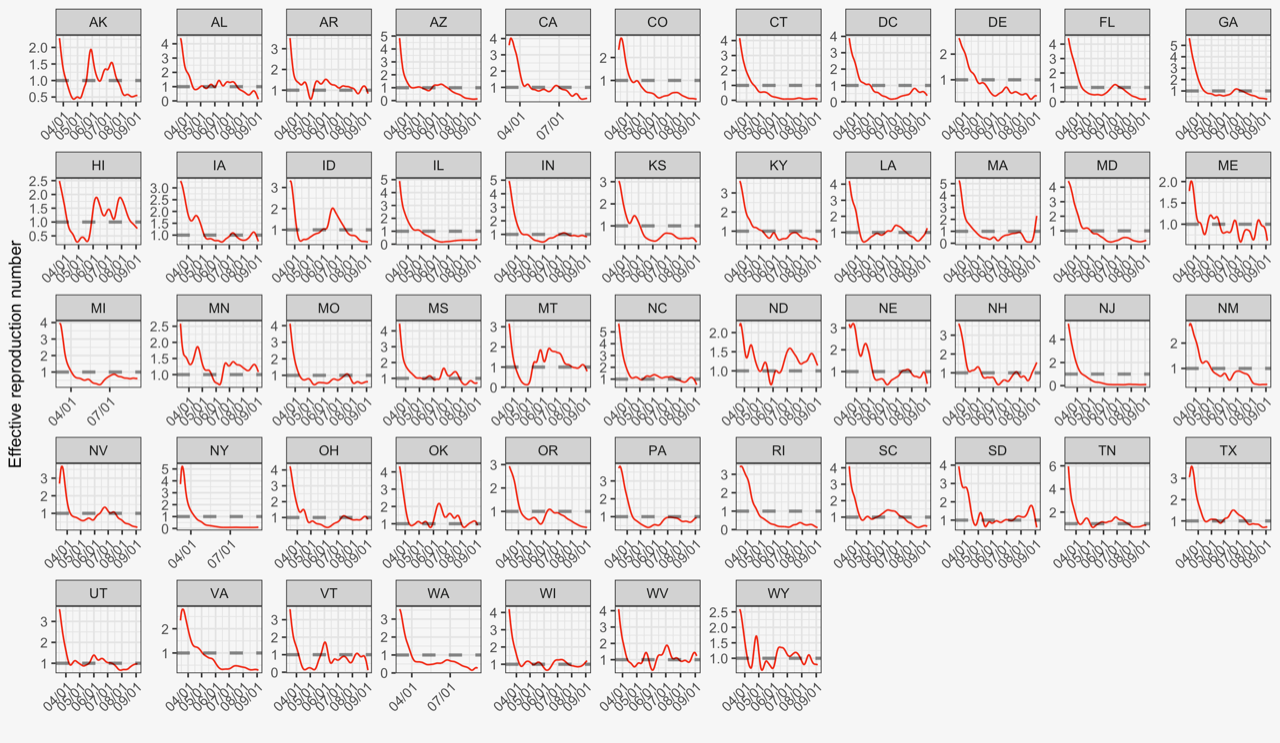
We estimate and assess the effective reproduction numbers of COVID-19 for 25 countries using an extended SEIR model. By comparing the countries’ reproduction curves over the first 4 weeks of the start of local transmission, we identify the successful strategies which may be useful for other countries to control the pandemic and the possible second wave. The study shows significant benefits in taking containment measures sooner with vigorous enforcement in reducing the effective reproduction number.
Read more →


