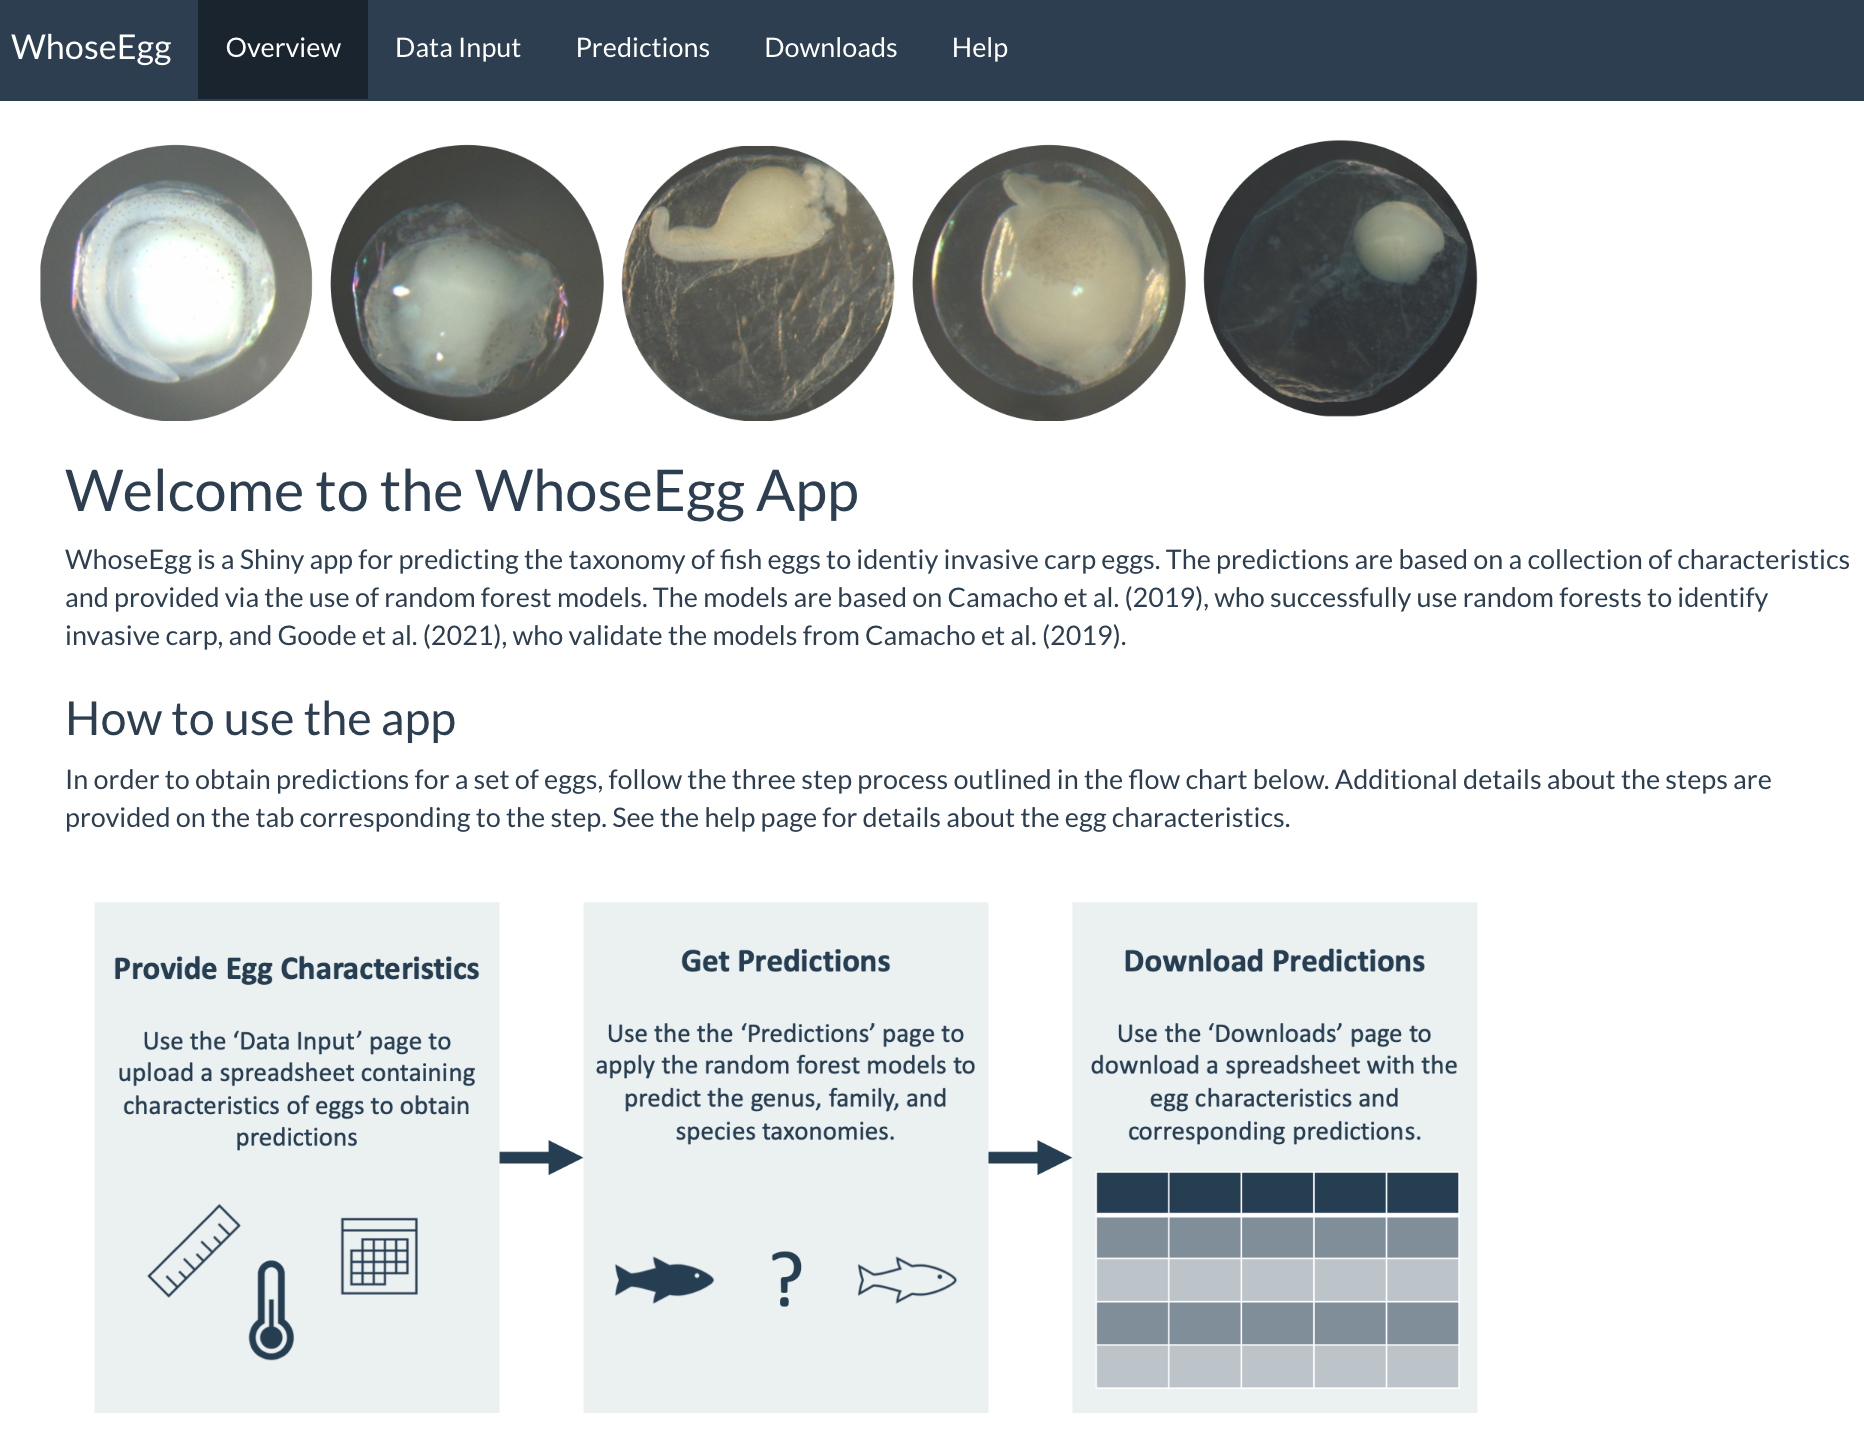
The fish species of Grass Carp (Ctenopharyngodon idella), Silver Carp (Hypophthalmichthys molitrix), and Bighead Carp (H. nobilis) are categorized as invasive carp in North America. There is interest from a natural resource management perspective to monitor the populations and spread of the fish species. A common monitoring practice is to collect and genetically identify fish eggs, but this process is both costly in money and time. Camacho et al. (2019) demonstrated the use of machine learning as a possibility for a more efficient method of identifying invasive carp.
Read more →
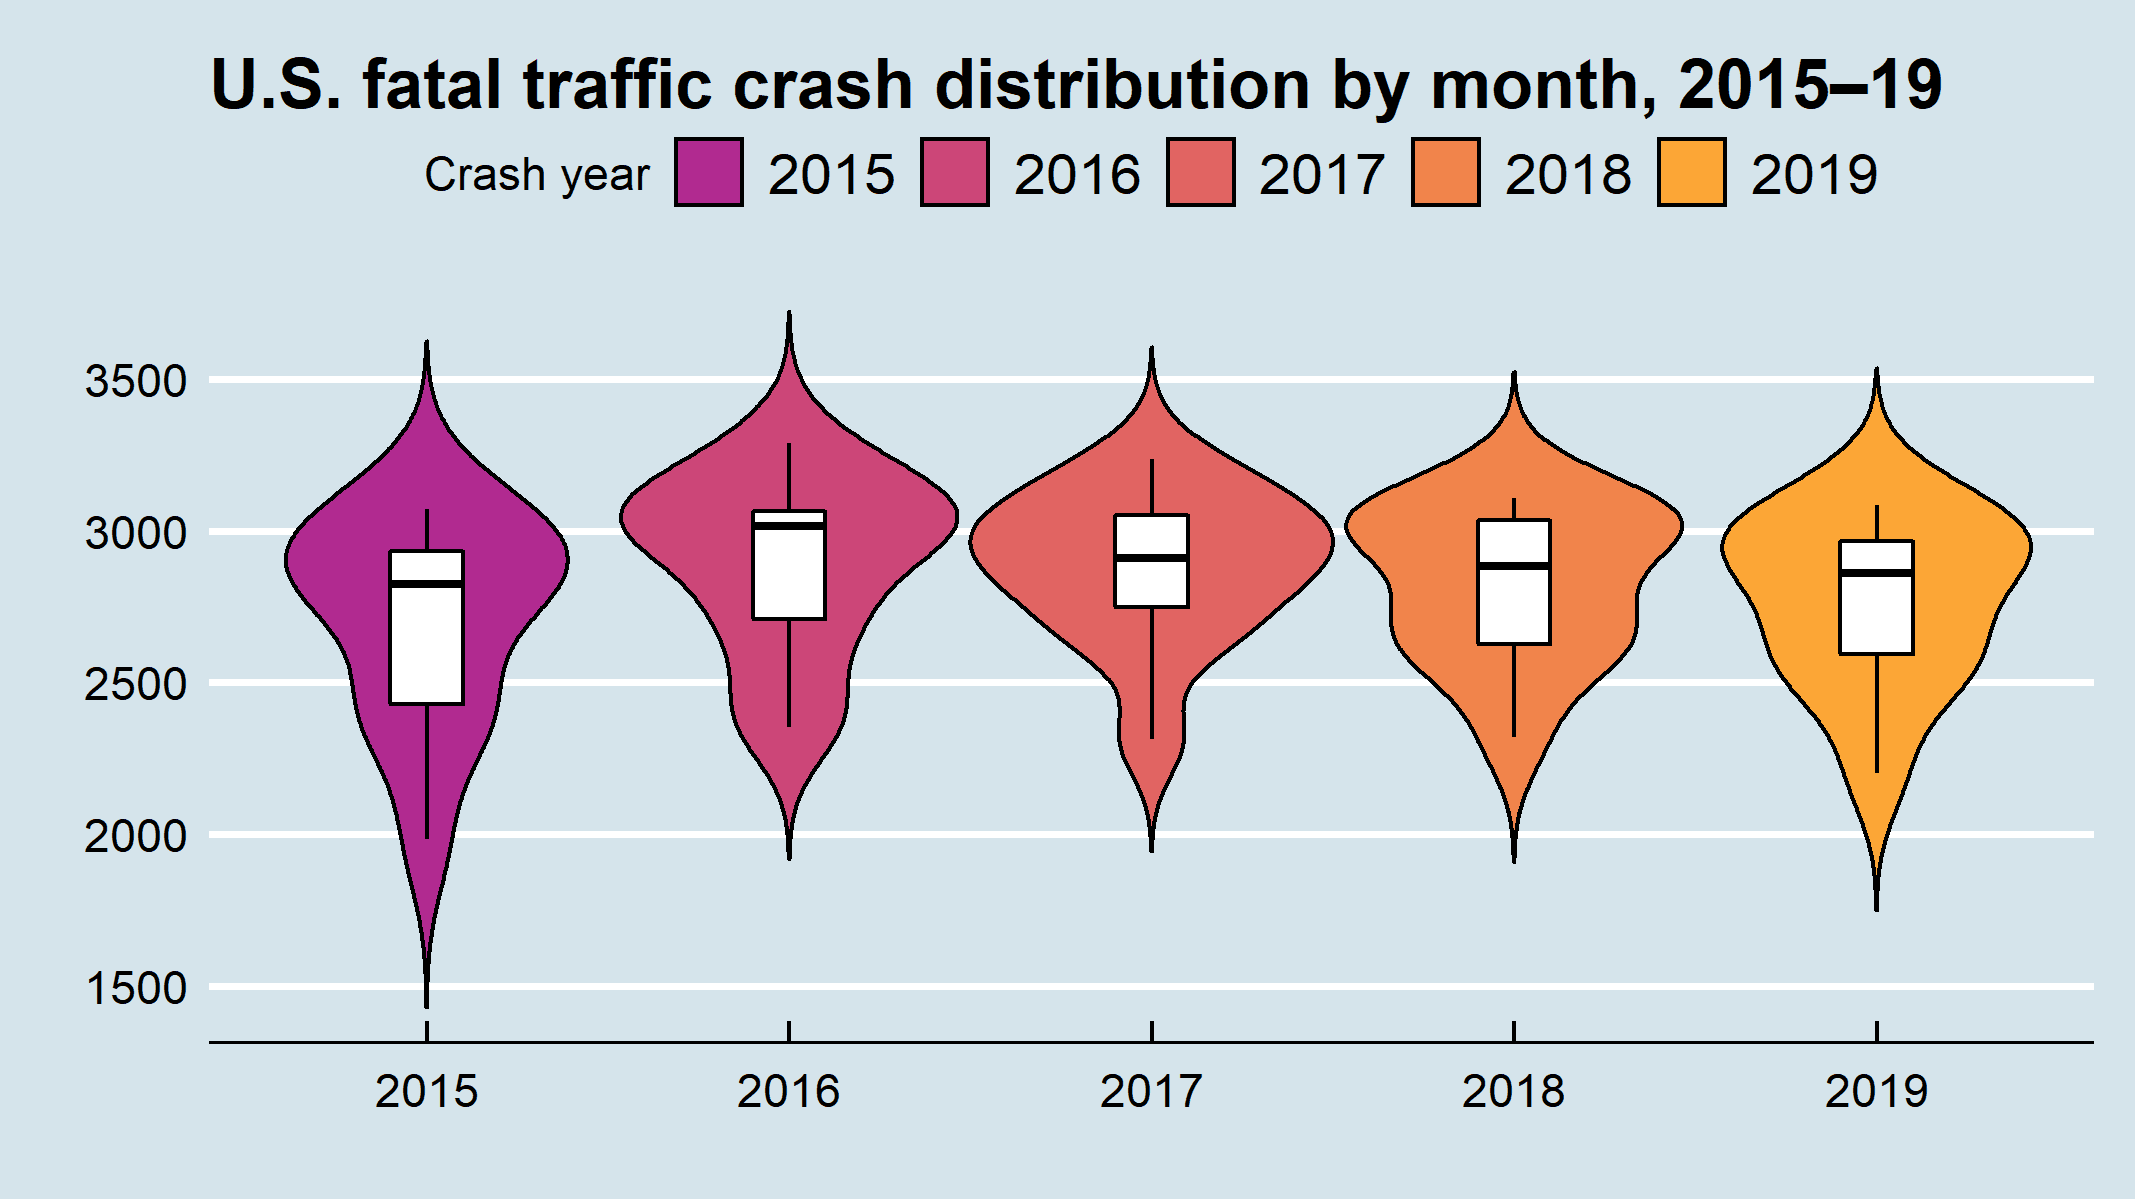
ggplot2 is an excellent package that allows R users to create stunning data visualizations using the grammar of graphics. Over the years, the R community has developed numerous extensions to ggplot2 that extend ggplot2’s graphing capabilities and allow for creating advanced data visualizations with much ease. In this talk, I will introduce some of my most frequently used ggplot2 extensions and demonstrate their use cases using walk-through examples.
The slides for the talk can be found here github
Read more →
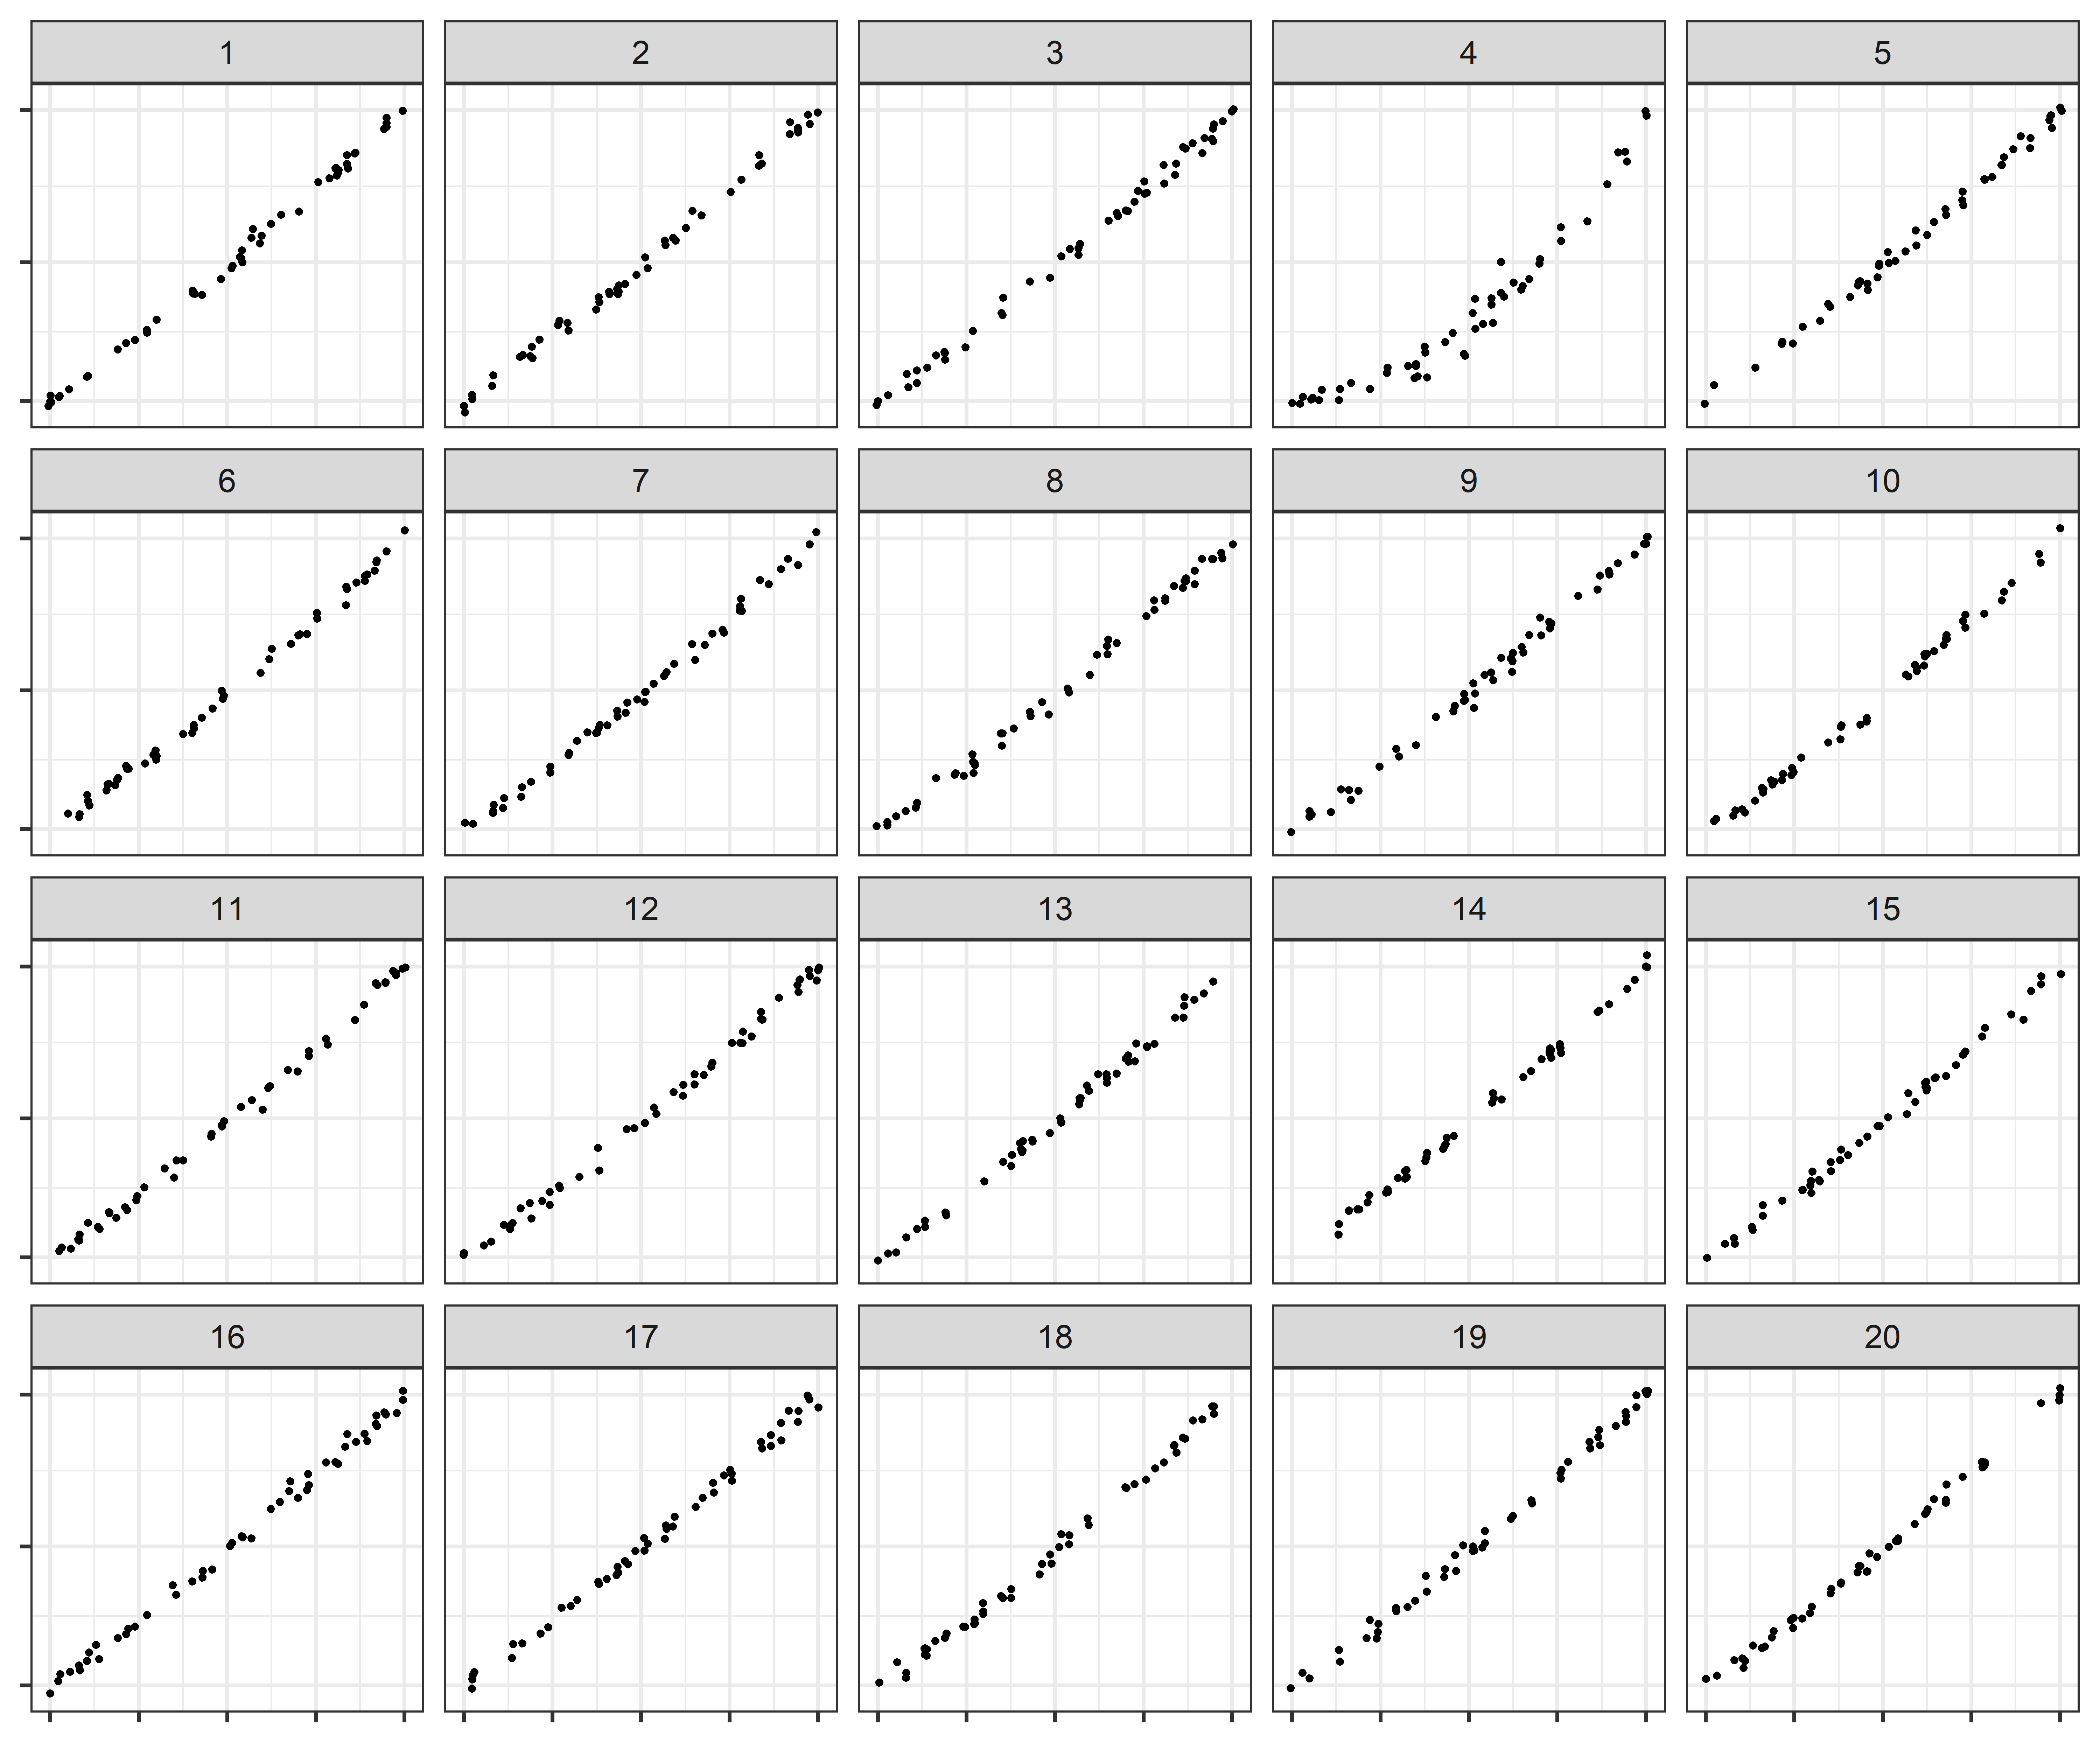
Log scales are often used to display data over several orders of magnitude within one graph. During the COVID-19 pandemic, we have seen both the benefits and the pitfalls of using log scales to display case counts. We explored the use of linear and log scales to determine whether our ability to notice differences in exponentially increasing trends is impacted by the choice of scale. We conducted a visual inference experiment in which participants were shown a series of lineup plots (consisting of 19 null panels and 1 target panel generated by differing model parameters) and asked to identify the panel that was most different from the others.
Read more →
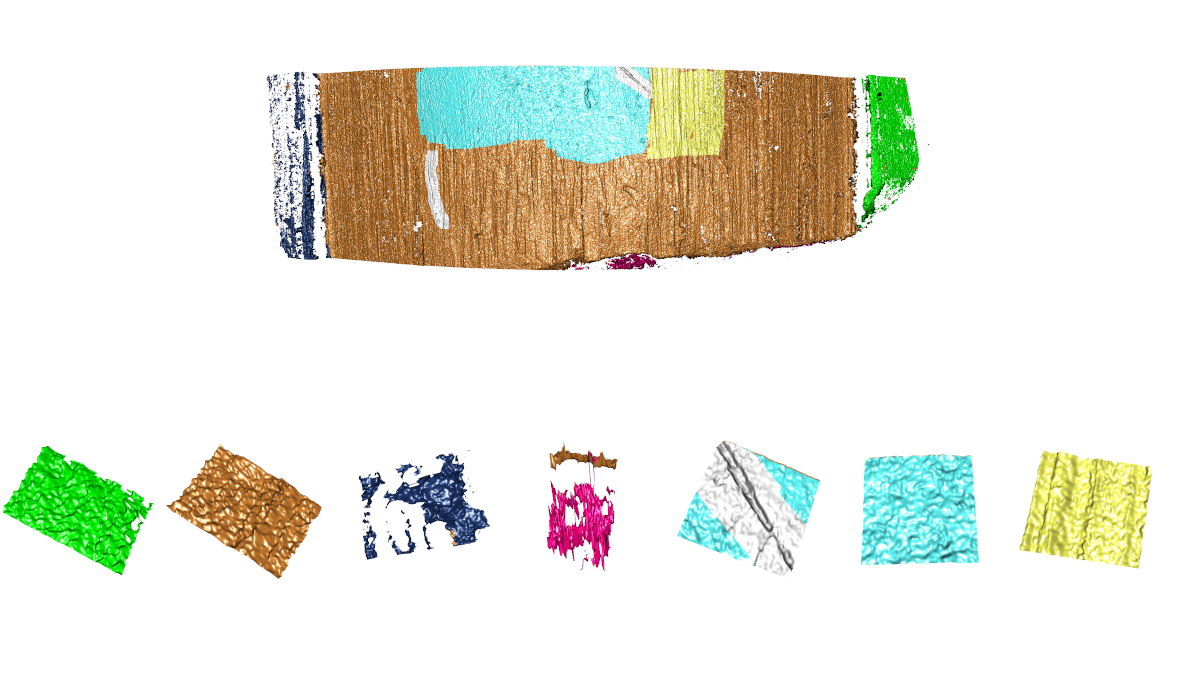
Accurately labeled data ensures a supervised learning algorithm’s ability to correctly classify new, unseen instances. Currently, sections of a land engraved area scan, represented as 3d topographical data, are annotated by a trained operator. Manually annotating land engraved area scans is a time-consuming process. We propose using trained neural networks to automate the labeling of these land engraved area scans. Using the currently labeled land engraved area scans, we present a data processing pipeline that transforms surface data for multi-classification 3d convolutional neural networks.
Read more →
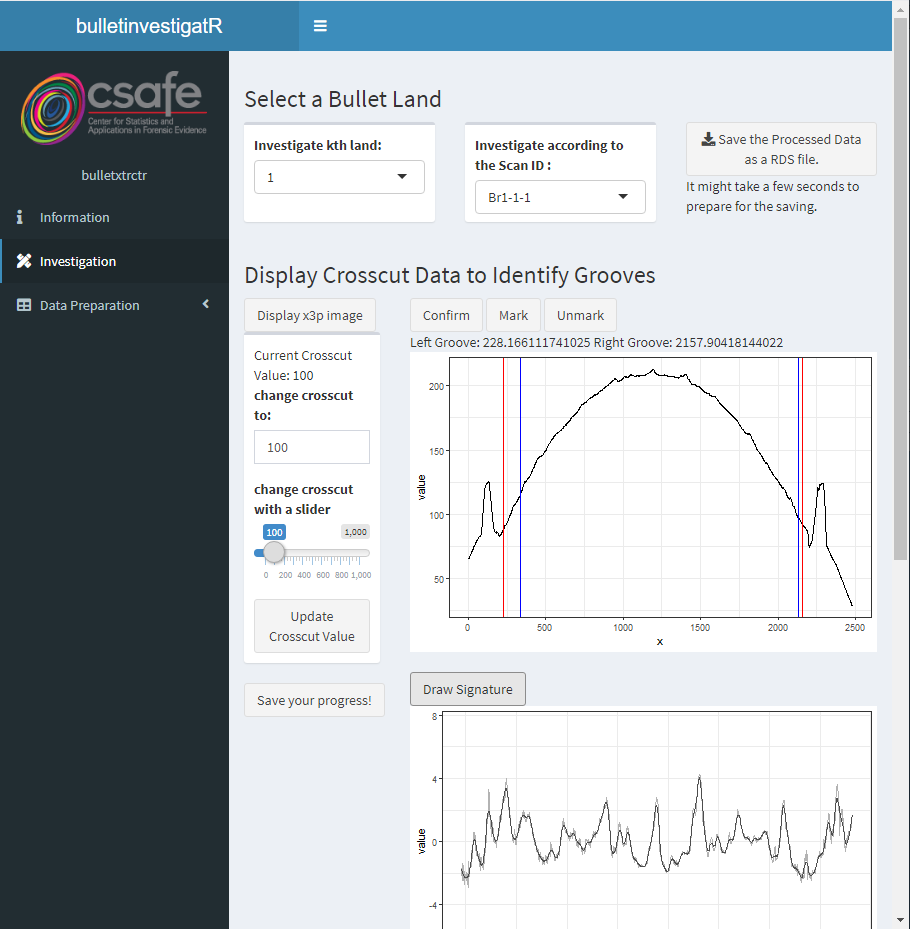
The R package bulletxtrctr provides many methods for analyzing bullet striations. And sometimes the results of these automated methods need some manual adjustments in order to be used in further analysis. To facilitate this process of manual adjustment and provide more insights into the data, we developed this interactive tool using Shiny. We also utilized Shiny Modules during the development of our app, which enables other developers to collaboratively extend the functionality of this app
Read more →


