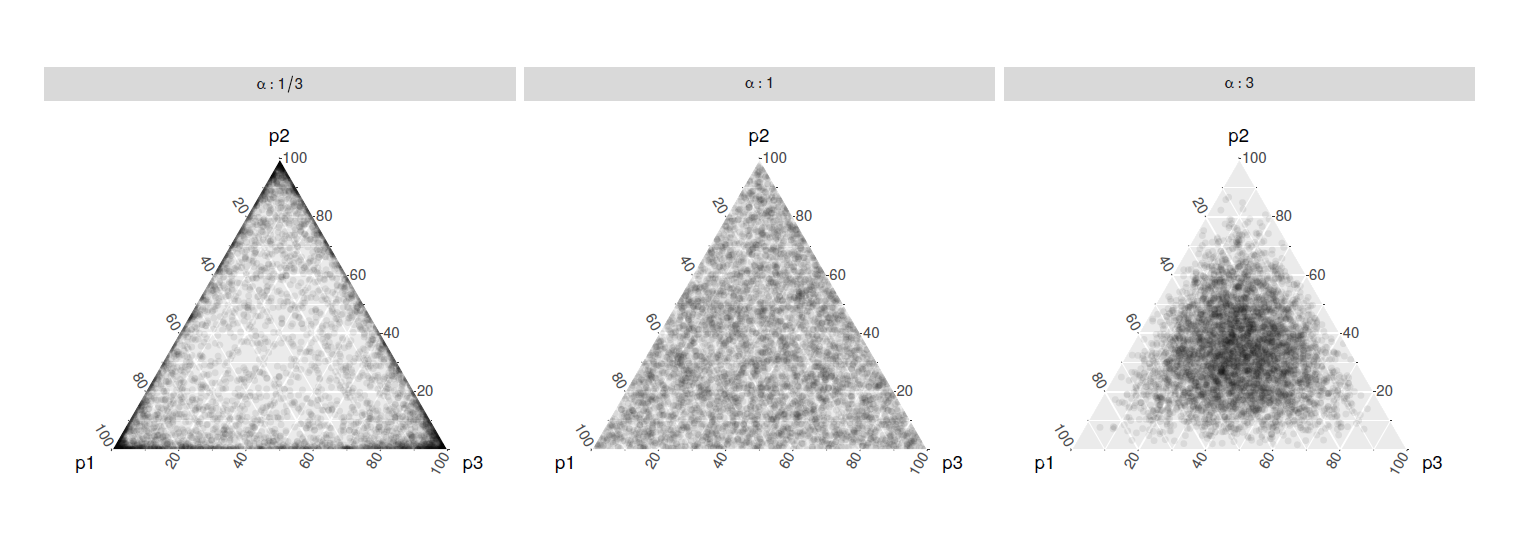
Statistical inference provides the protocols for conducting rigorous science, but data plots provide the opportunity to discover the unexpected. These disparate endeavors are bridged by visual inference, where a lineup protocol can be employed for statistical testing. Human observers are needed to assess the lineups, typically using a crowd-sourcing service. This paper describes a new approach for computing statistical significance associated with the results from applying a lineup protocol. It utilizes a Dirichlet distribution to accommodate different levels of visual interest in individual null panels.
Read more →
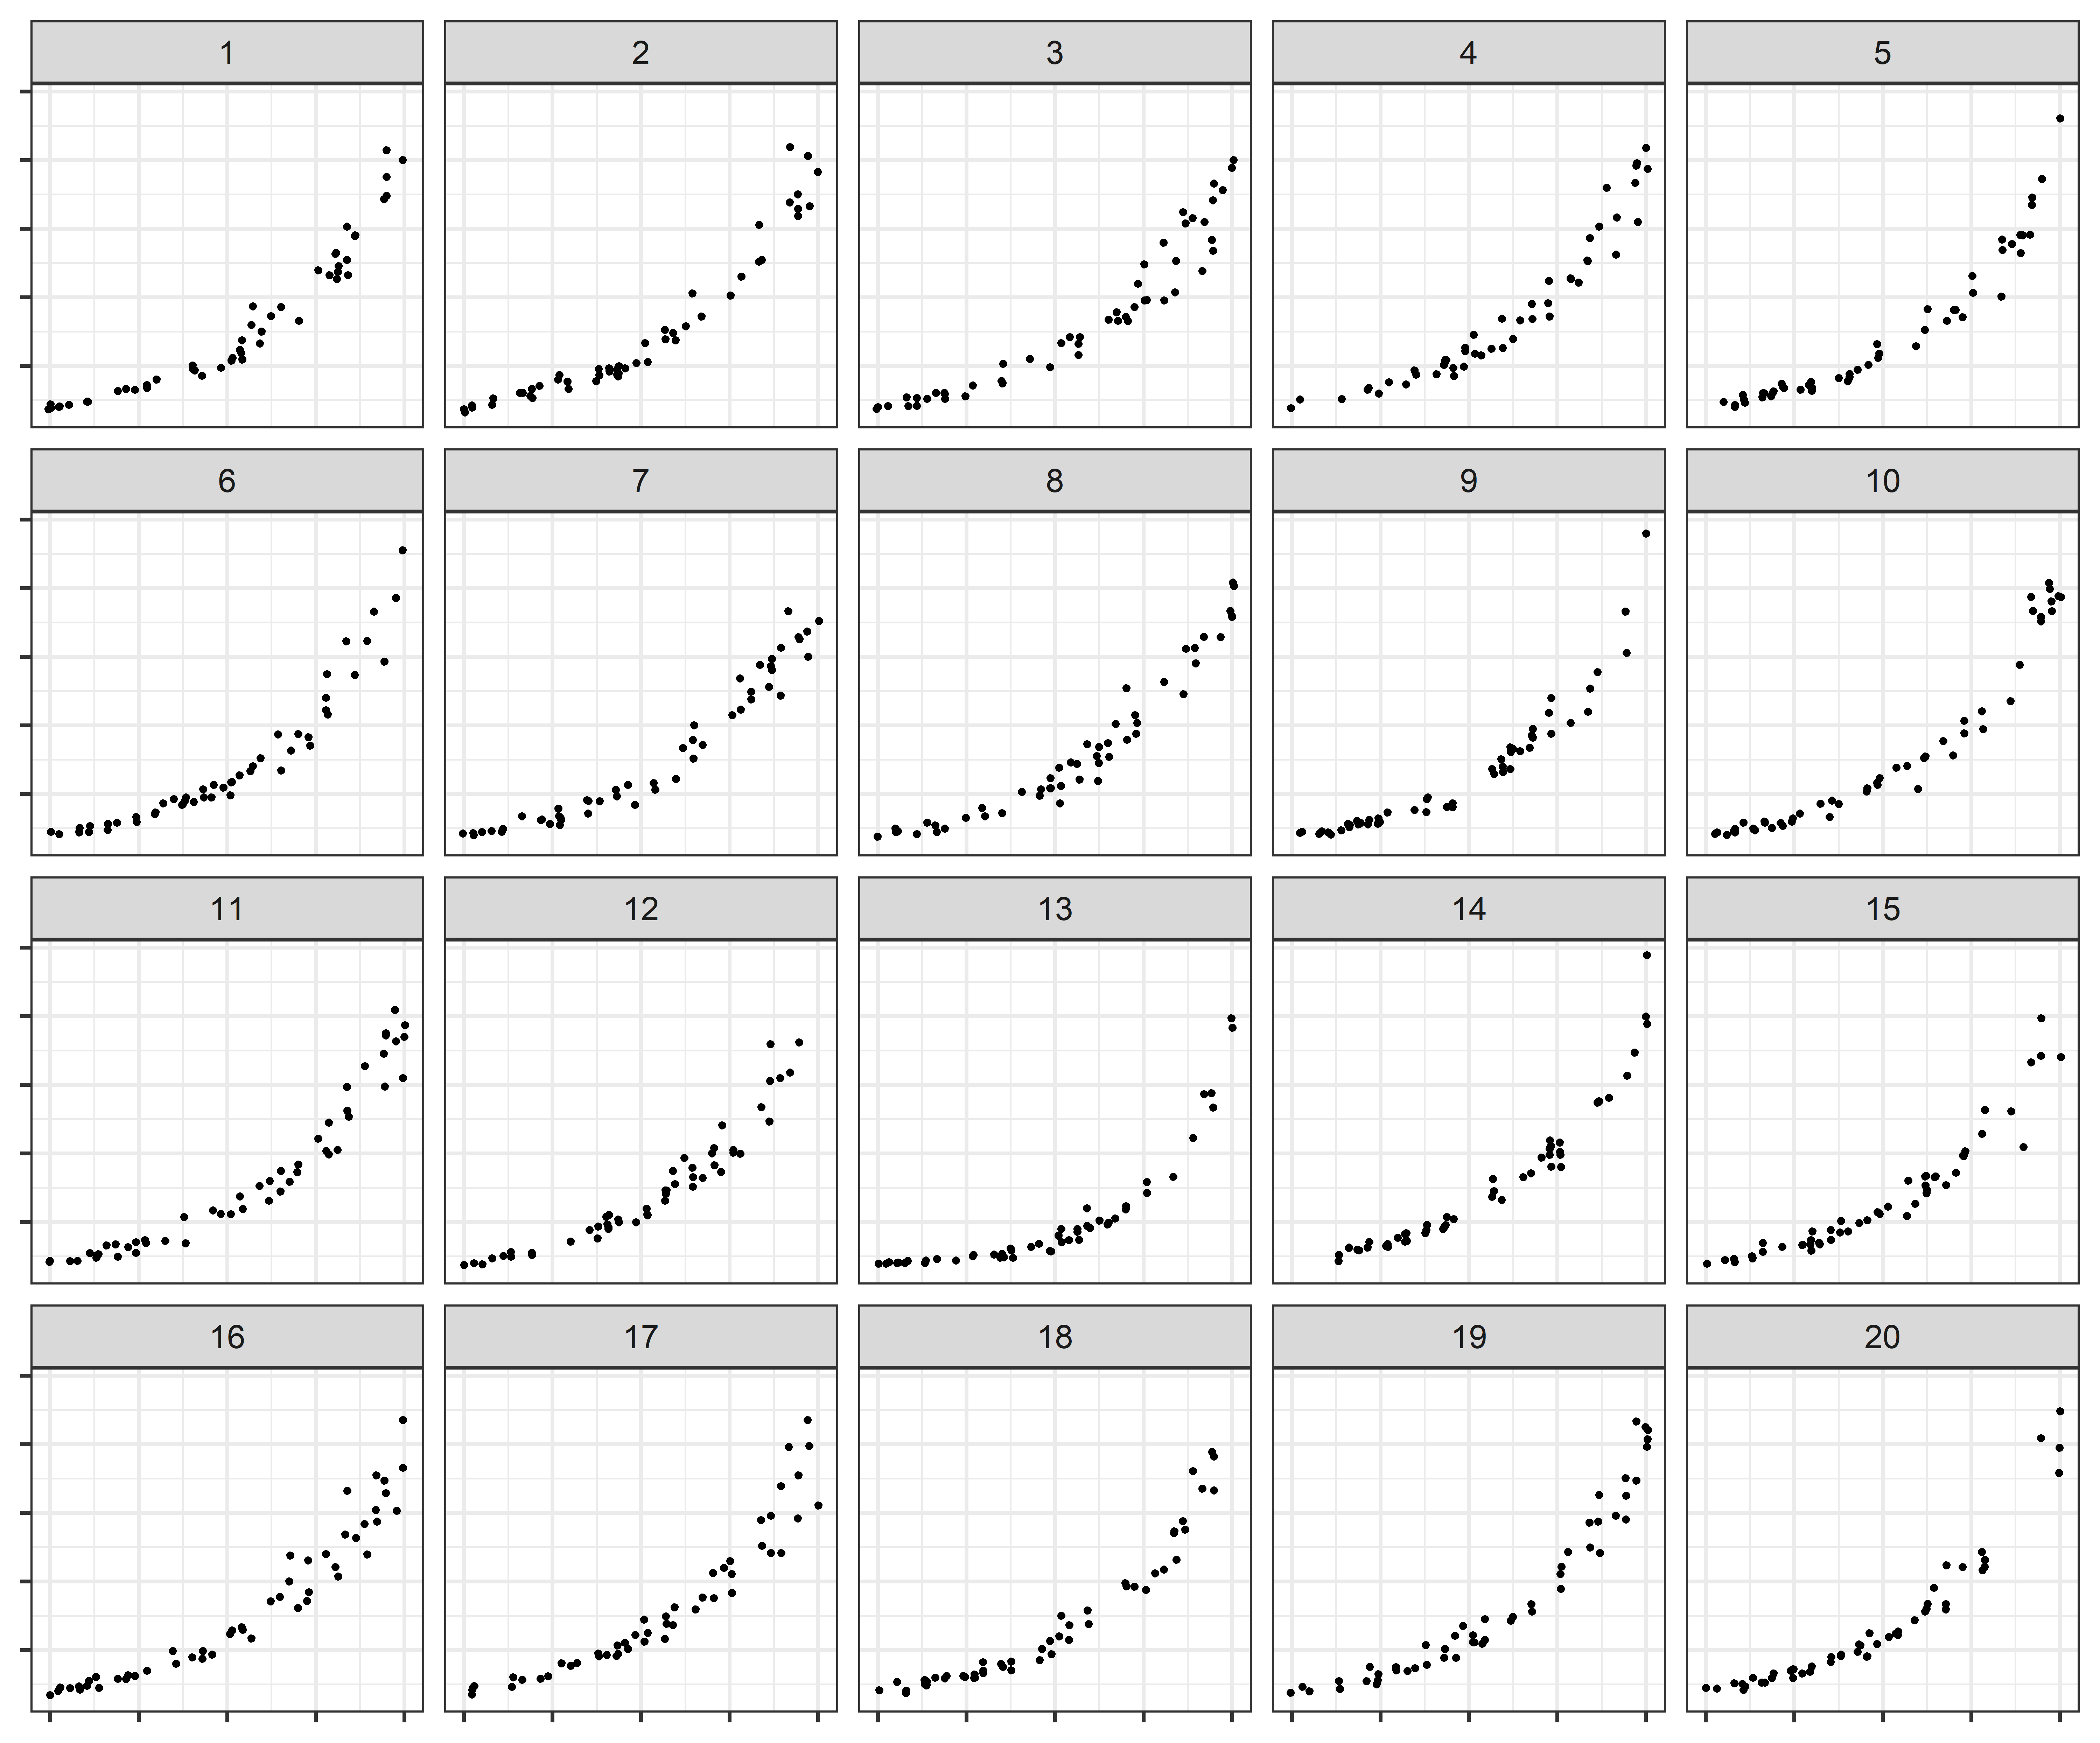
Log scales are often used to display data over several orders of magnitude within one graph. During the COVID pandemic, we’ve seen both the benefits and the pitfalls of using log scales to display data. In this week’s graphics group, we will test out an experiment designed to assess perceptual and cognitive biases in graphical displays of exponentially increasing data.
Read more →