While eating jellybeans isn’t as hazardous in the real world as in the Harry Potter universe, it can still be unexpectedly interesting: you think you have a few raspberry flavored beans, but how do you know one of them isn’t actually cinnamon? In an effort to combat this anxiety-inducing problem, we collected several sets of image data. I’ll talk about how we applied computer vision techniques to isolate the beans and extract useful features from the images (as well as the associated challenges).
Read more →
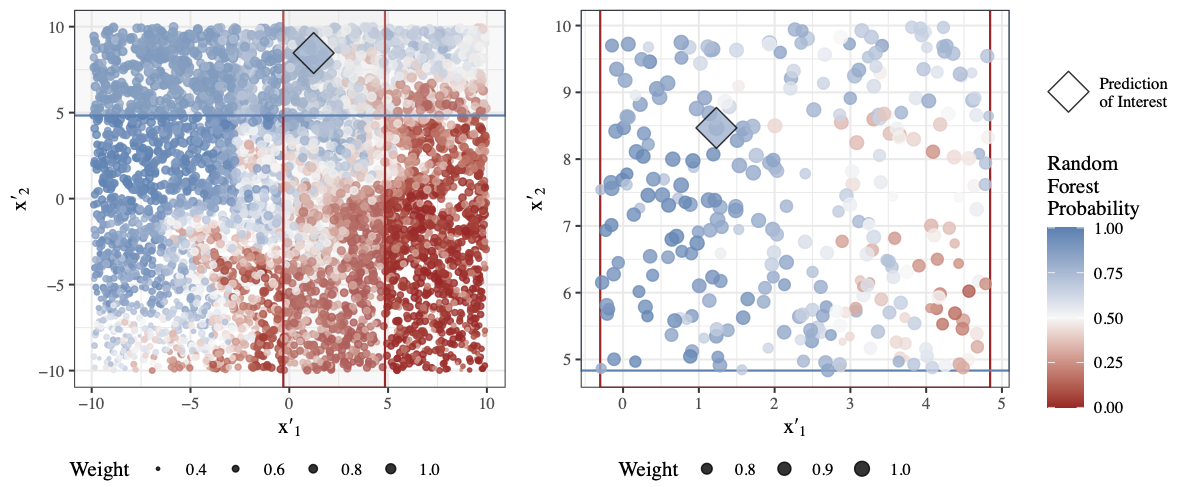
Machine learning models are excellent predictors, but it is impractical to interpret many of these models. Despite this impracticality, it is important to be able to explain predictions to assess and validate models. As a result, a field of research has recently developed in the explainability of machine learning models. In this talk, I will provide an overview of explainable machine learning with a focus on visualization methods. I will discuss philosophies of “explainability”, model agnostic and model specific visualization methods, and code for creating some of the visualizations in R.
Read more →
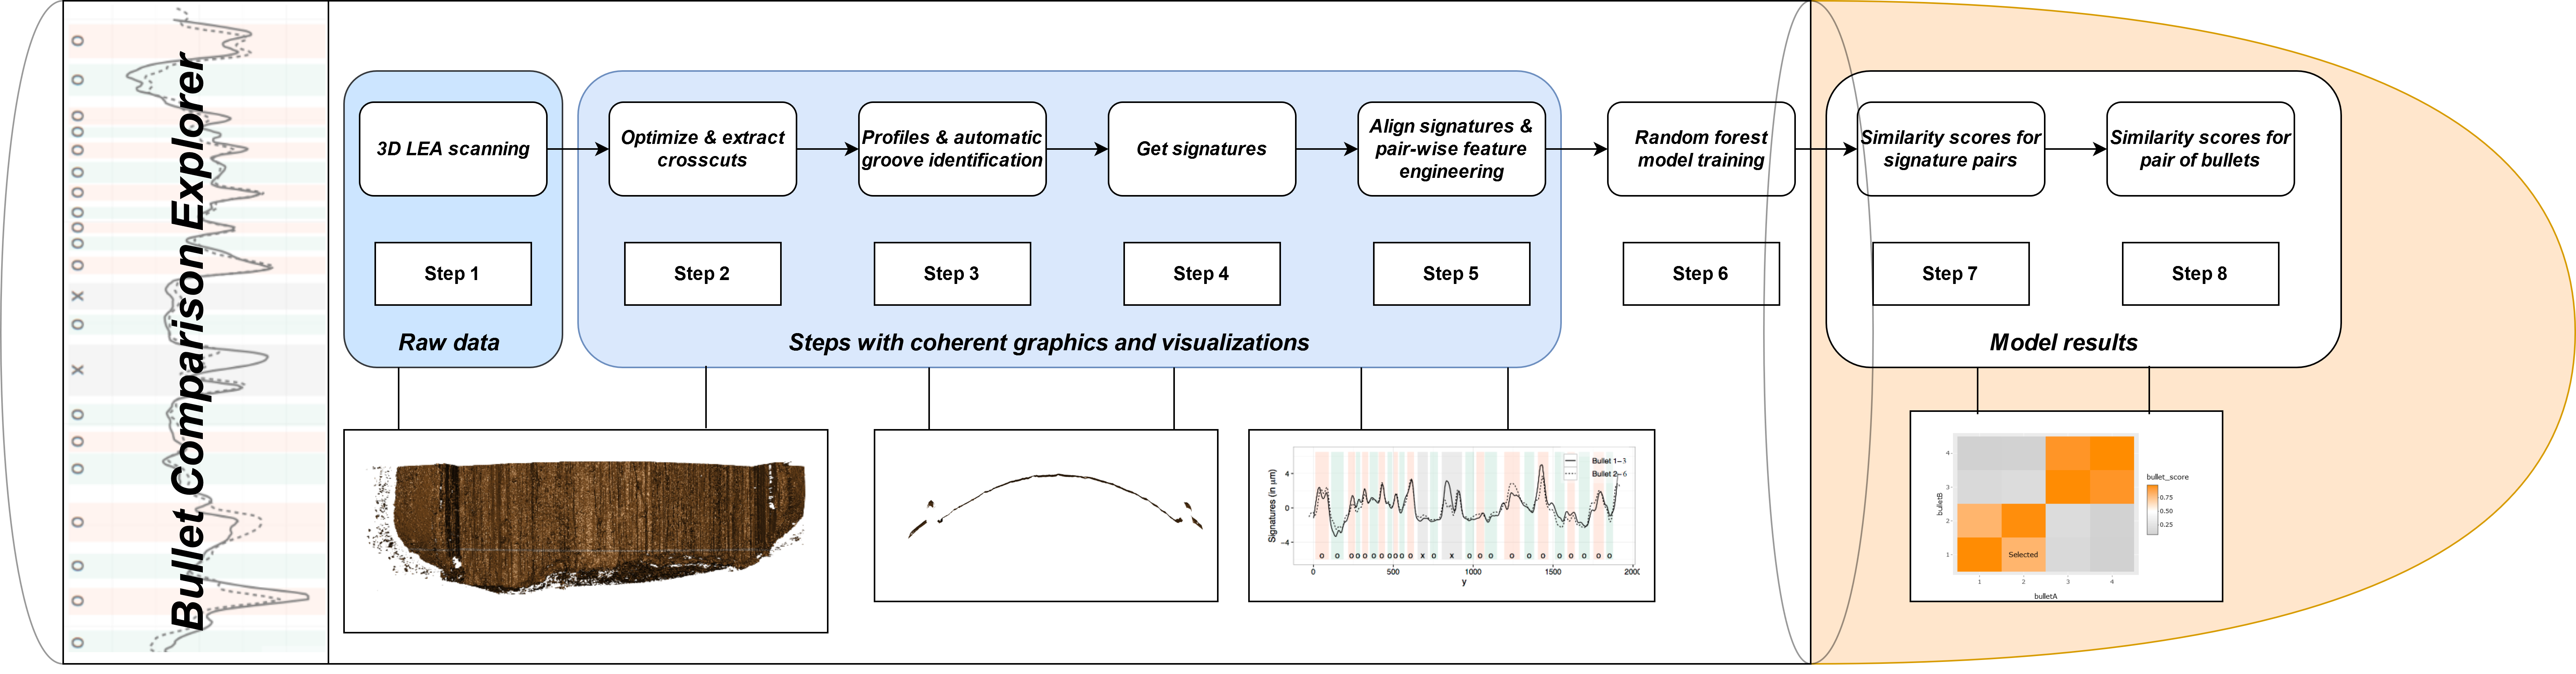
Forensic firearms examiners subjectively compare two bullets, using visual examination to make a determination about whether the bullets are similar enough to have originated from the same weapon. Recently, there has been increased demand for quantitative, objective similarity assessment methods for many types of forensic evidence, including bullets. In this talk, we discuss visualizations for a machine learning algorithm capable of matching striation marks on fired bullets. We describe the steps of the algorithm and summary visualizations used at each stage of the data science pipeline, and present an application which wraps the visualizations into an interactive exploration tool.
Read more →
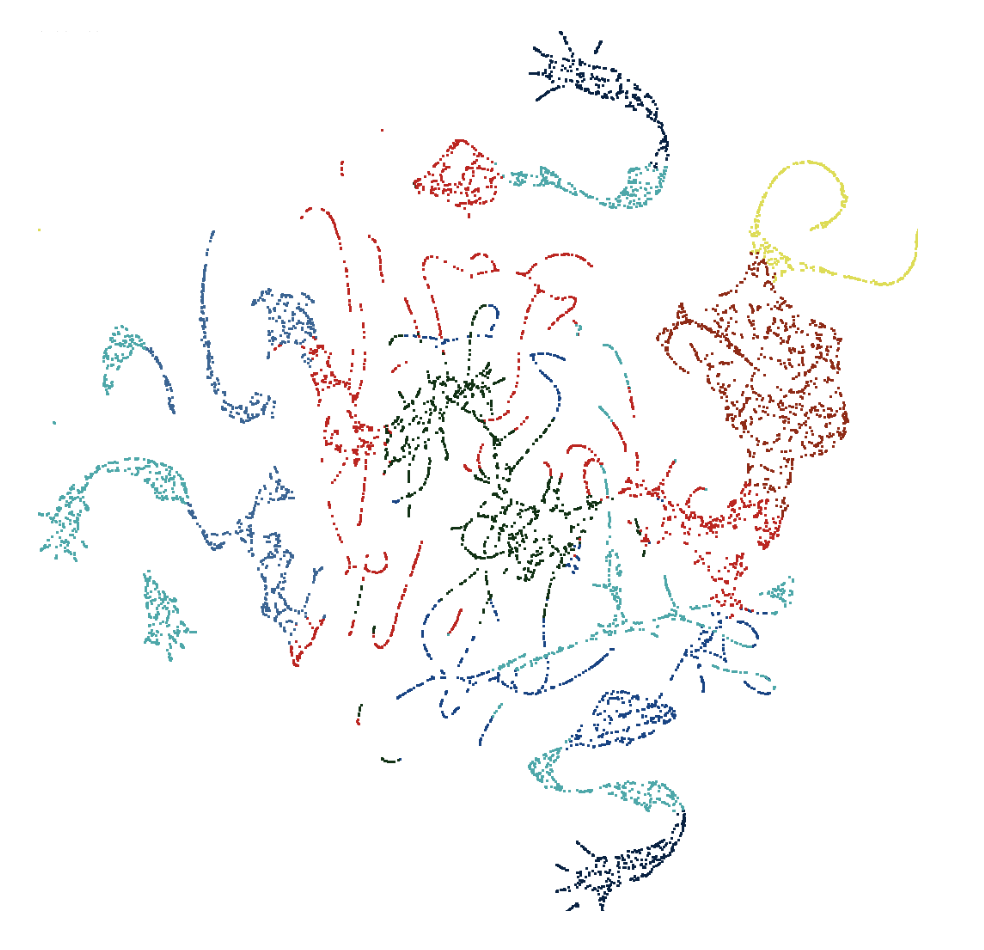
One of our fundamental tasks as data scientists, especially given our focus on statistical graphics, is to take a potentially large and messy dataset, and extract meaningful relationships and patterns from it. One such approach to this is dimension reduction, the task of reducing the number of variables in a dataset to a much smaller number that still captures the structure of the original data well. A commonly used technique for dimension reduction is PCA, or Principal Component Analysis, where transformations of the variables are made in order to extract a set of uncorrelated principal components from the data.
Read more →