Do logs work during a pandemic- Perception of exponentially increasing data

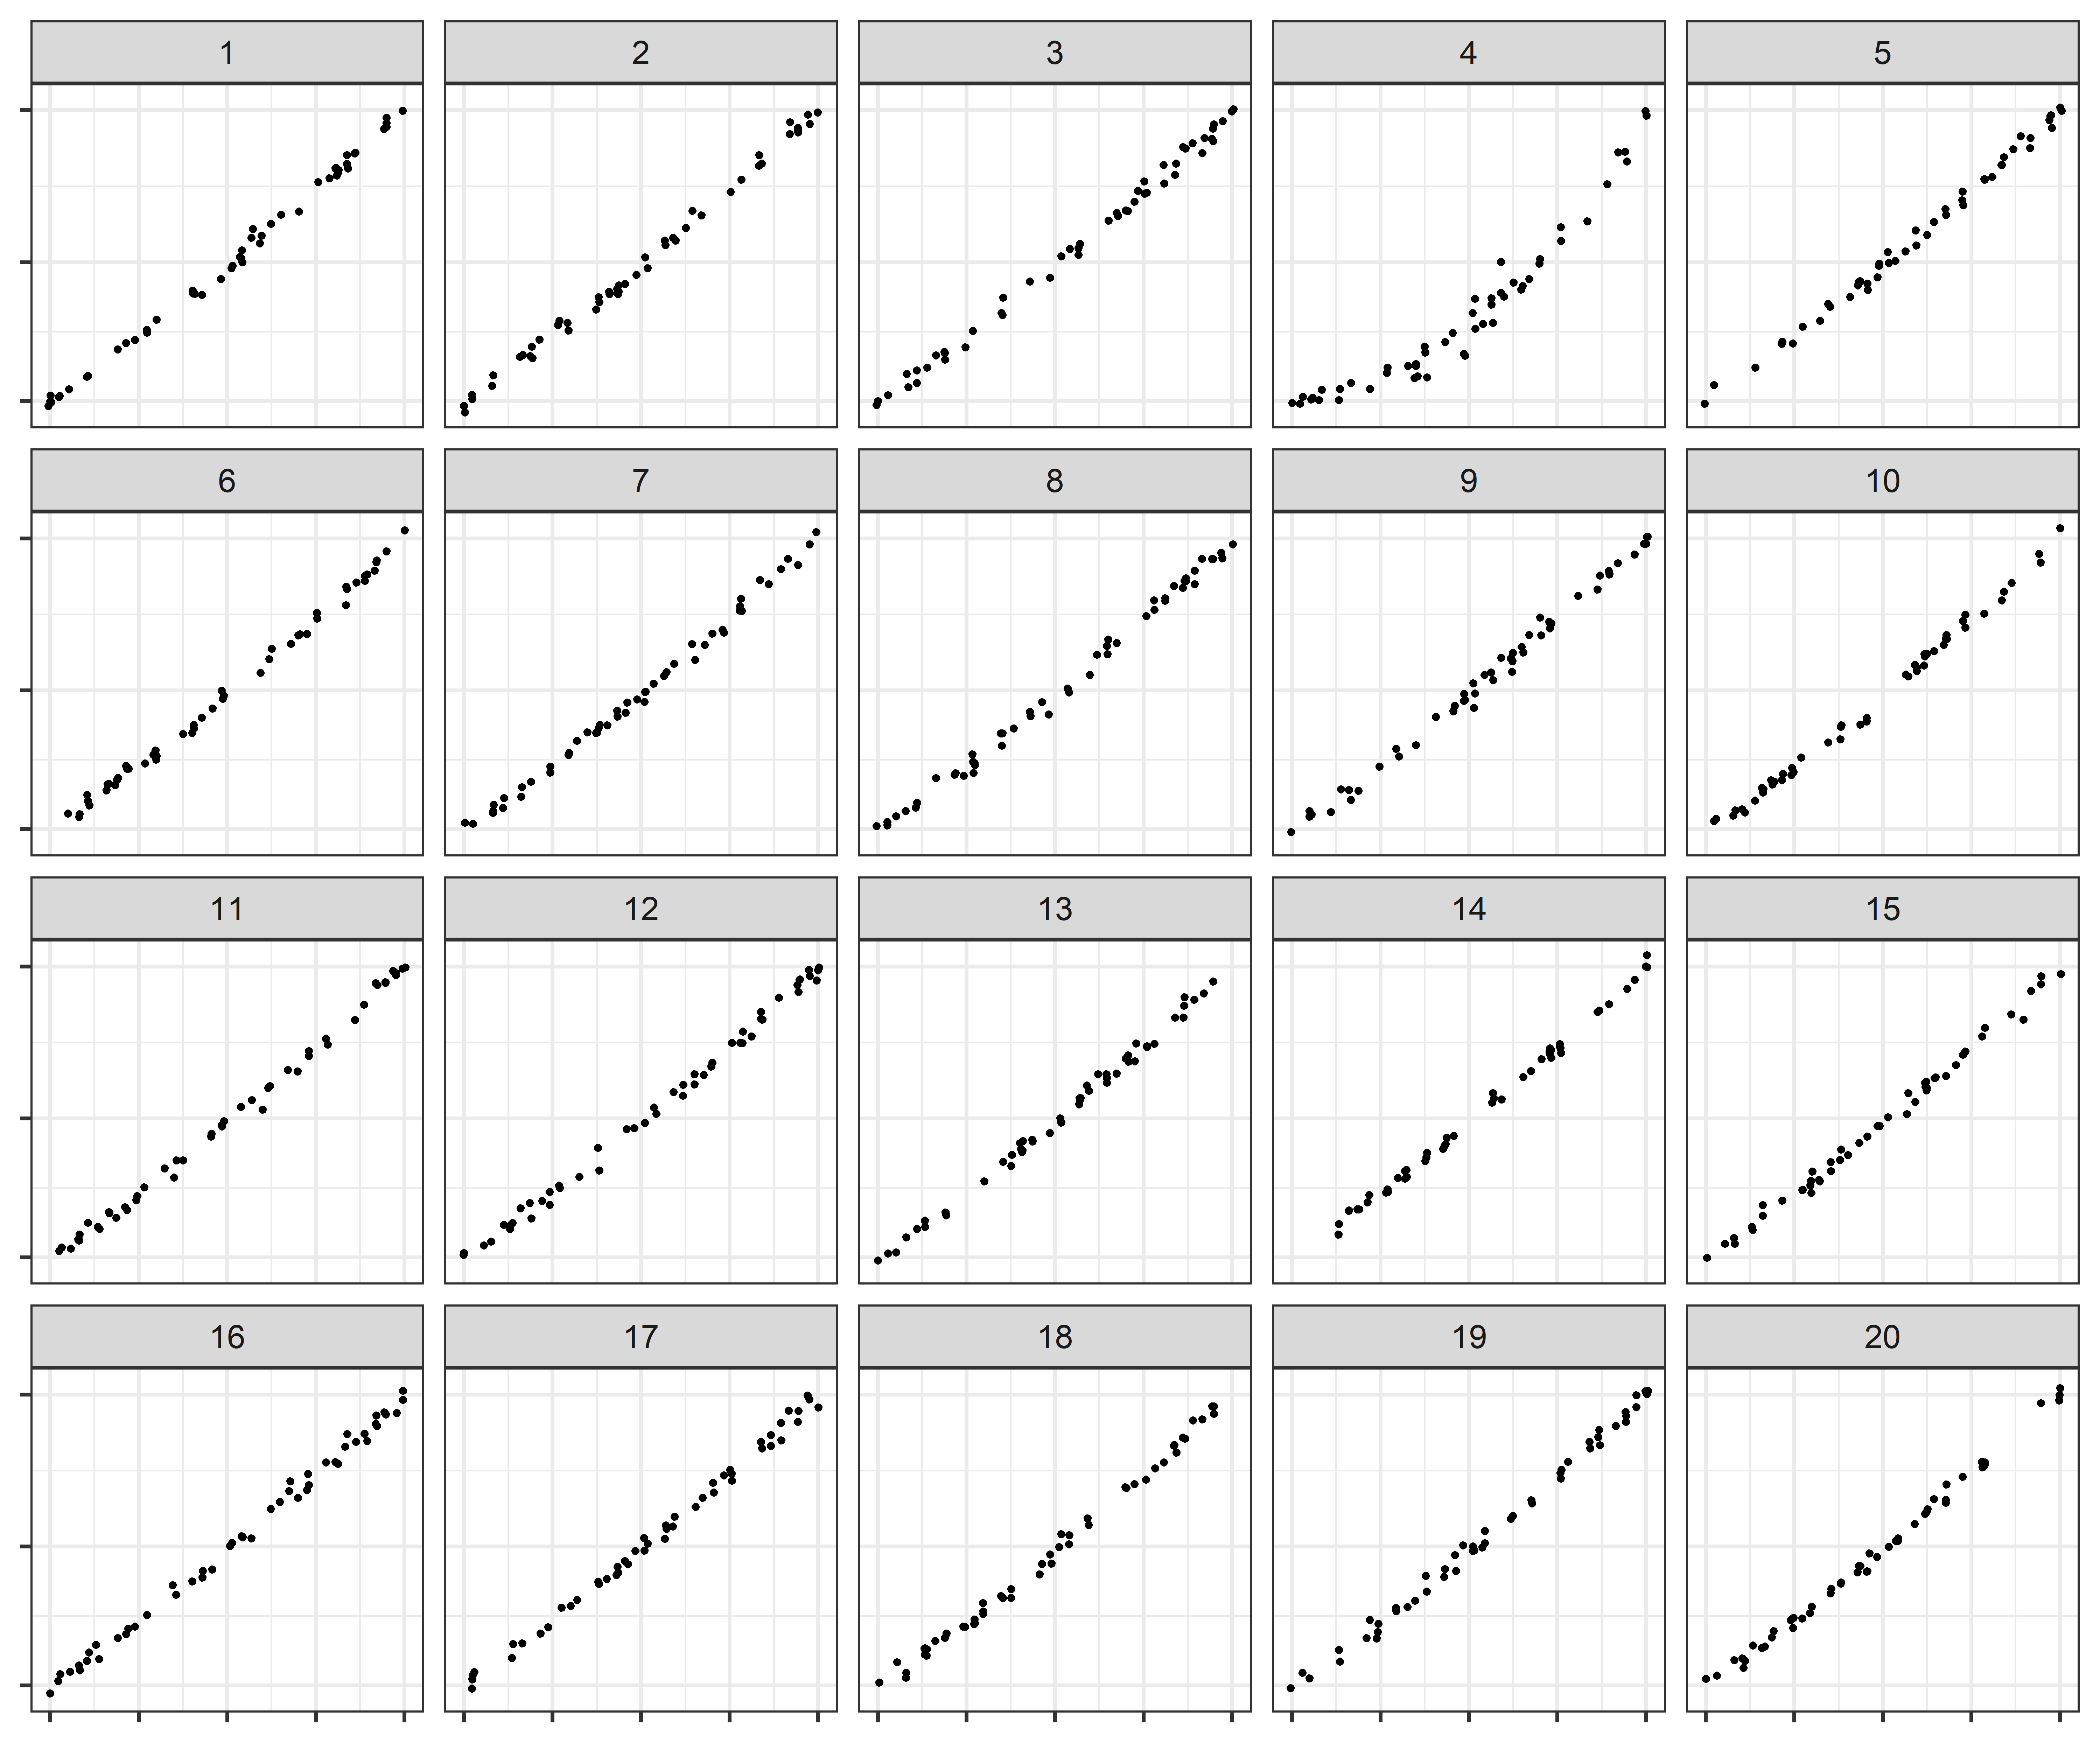
Log scales are often used to display data over several orders of magnitude within one graph. During the COVID-19 pandemic, we have seen both the benefits and the pitfalls of using log scales to display case counts. We explored the use of linear and log scales to determine whether our ability to notice differences in exponentially increasing trends is impacted by the choice of scale. We conducted a visual inference experiment in which participants were shown a series of lineup plots (consisting of 19 null panels and 1 target panel generated by differing model parameters) and asked to identify the panel that was most different from the others. Our results indicated that when there was a large difference in curvature between the target plot and null plots, the choice of scale had no impact and participants accurately differentiated between the two curves on both the linear and log scale. However, displaying exponentially increasing data on a log scale improved the accuracy of differentiating between models with slight curvature differences. An exception occurred when identifying a plot with curvature embedded in surrounding plots closely relating to a linear trend, indicating that it is easy to identify a curve in a group of lines but much harder to identify a line in a group of curves. The use of visual inference to identify these guidelines suggests that there are perceptual advantages to log scales when differences are subtle.
