Perception of exponential data displayed on a log scale
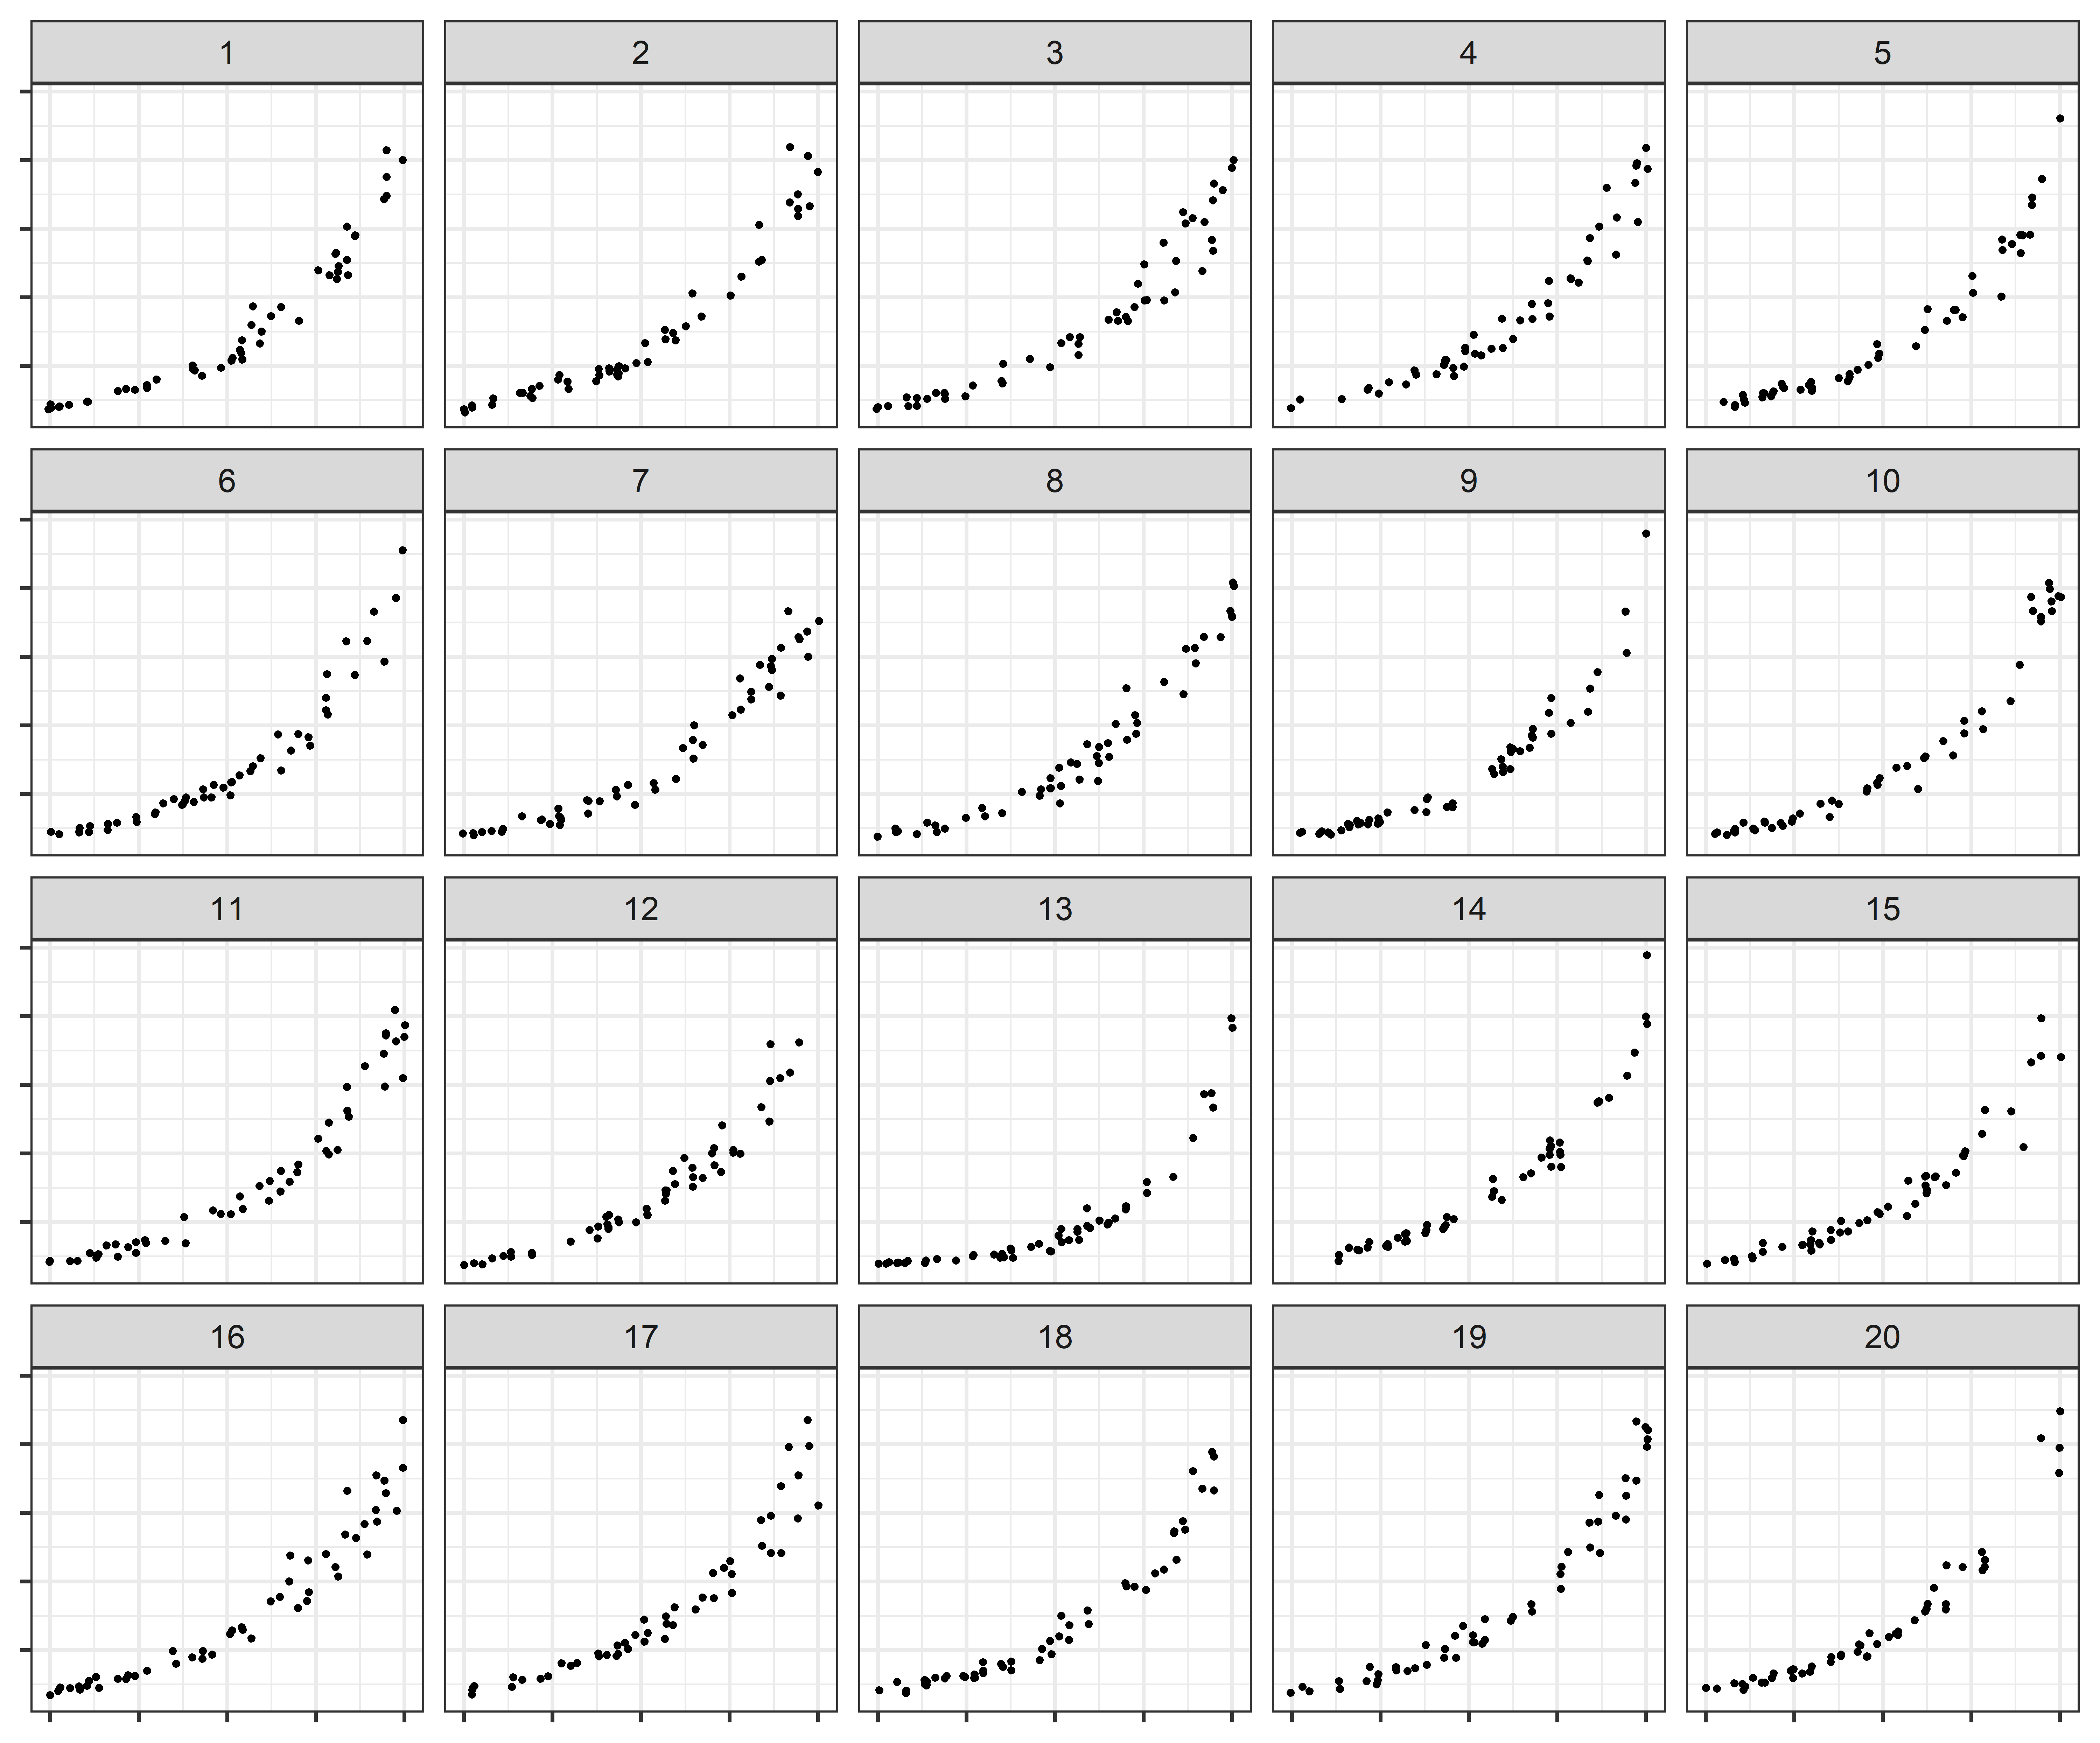
Log scales are often used to display data over several orders of magnitude within one graph. During the COVID pandemic, we’ve seen both the benefits and the pitfalls of using log scales to display data. In this week’s graphics group, we will test out an experiment designed to assess perceptual and cognitive biases in graphical displays of exponentially increasing data.