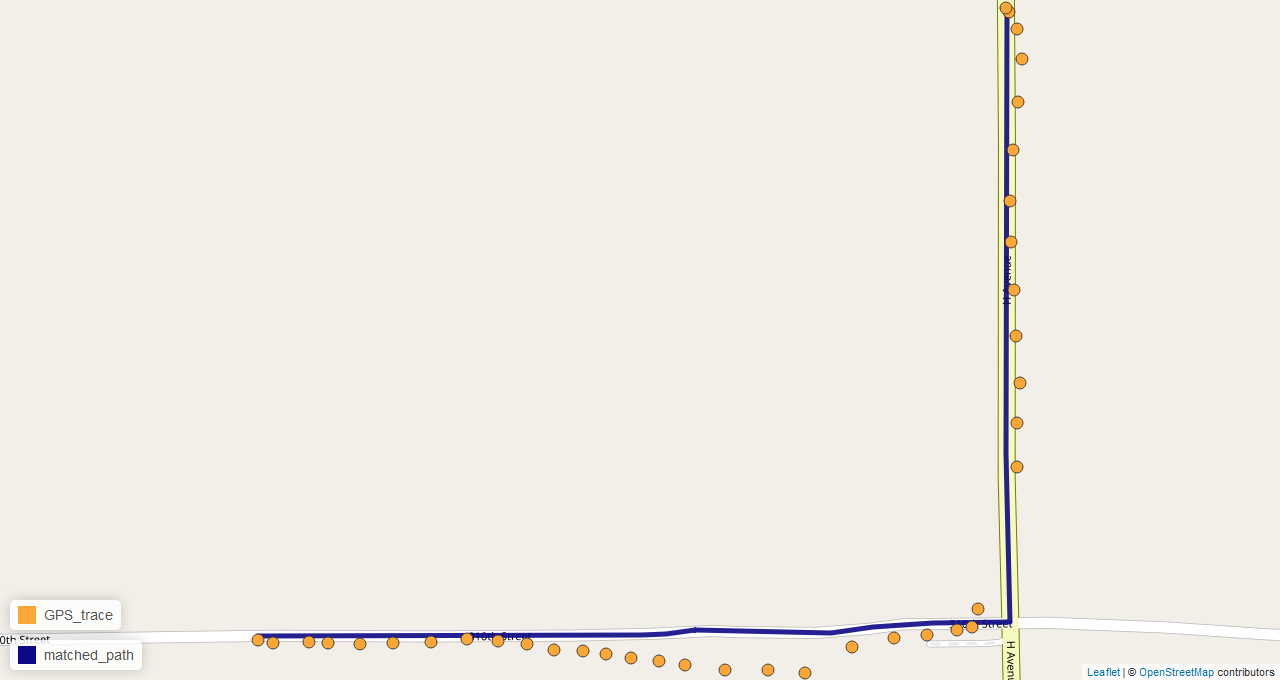
Map matching is an interesting problem that involves snapping noisy GPS traces to a road network with a high degree of accuracy. It is used by ride-sharing services such as Uber and Lyft, transportation researchers, highway agencies, auto insurance companies, and many others for gaining insights into driver behavior and travel patterns as well as improving operational efficiency. There are various commercial and open source map matching solutions available for use such as Google’s Snap to Roads API, Mapbox’ Map Matching API, and QGIS’s map matching plugin; however, these options are either very expensive (e.
Read more →

In today’s day and age, U.S. society is inundated with information about politics and elections from all around the world. Particularly in a U.S. Presidential election year, the news is full of predictions, results, and stories about the primary and Presidential elections. The key to effectively communicating a message about election data lies in graphical presentation of statistical information. In this talk, I will present a history of innovation in election graphics including results, predictions, voter turnout, and campaigns and advertising.
Read more →