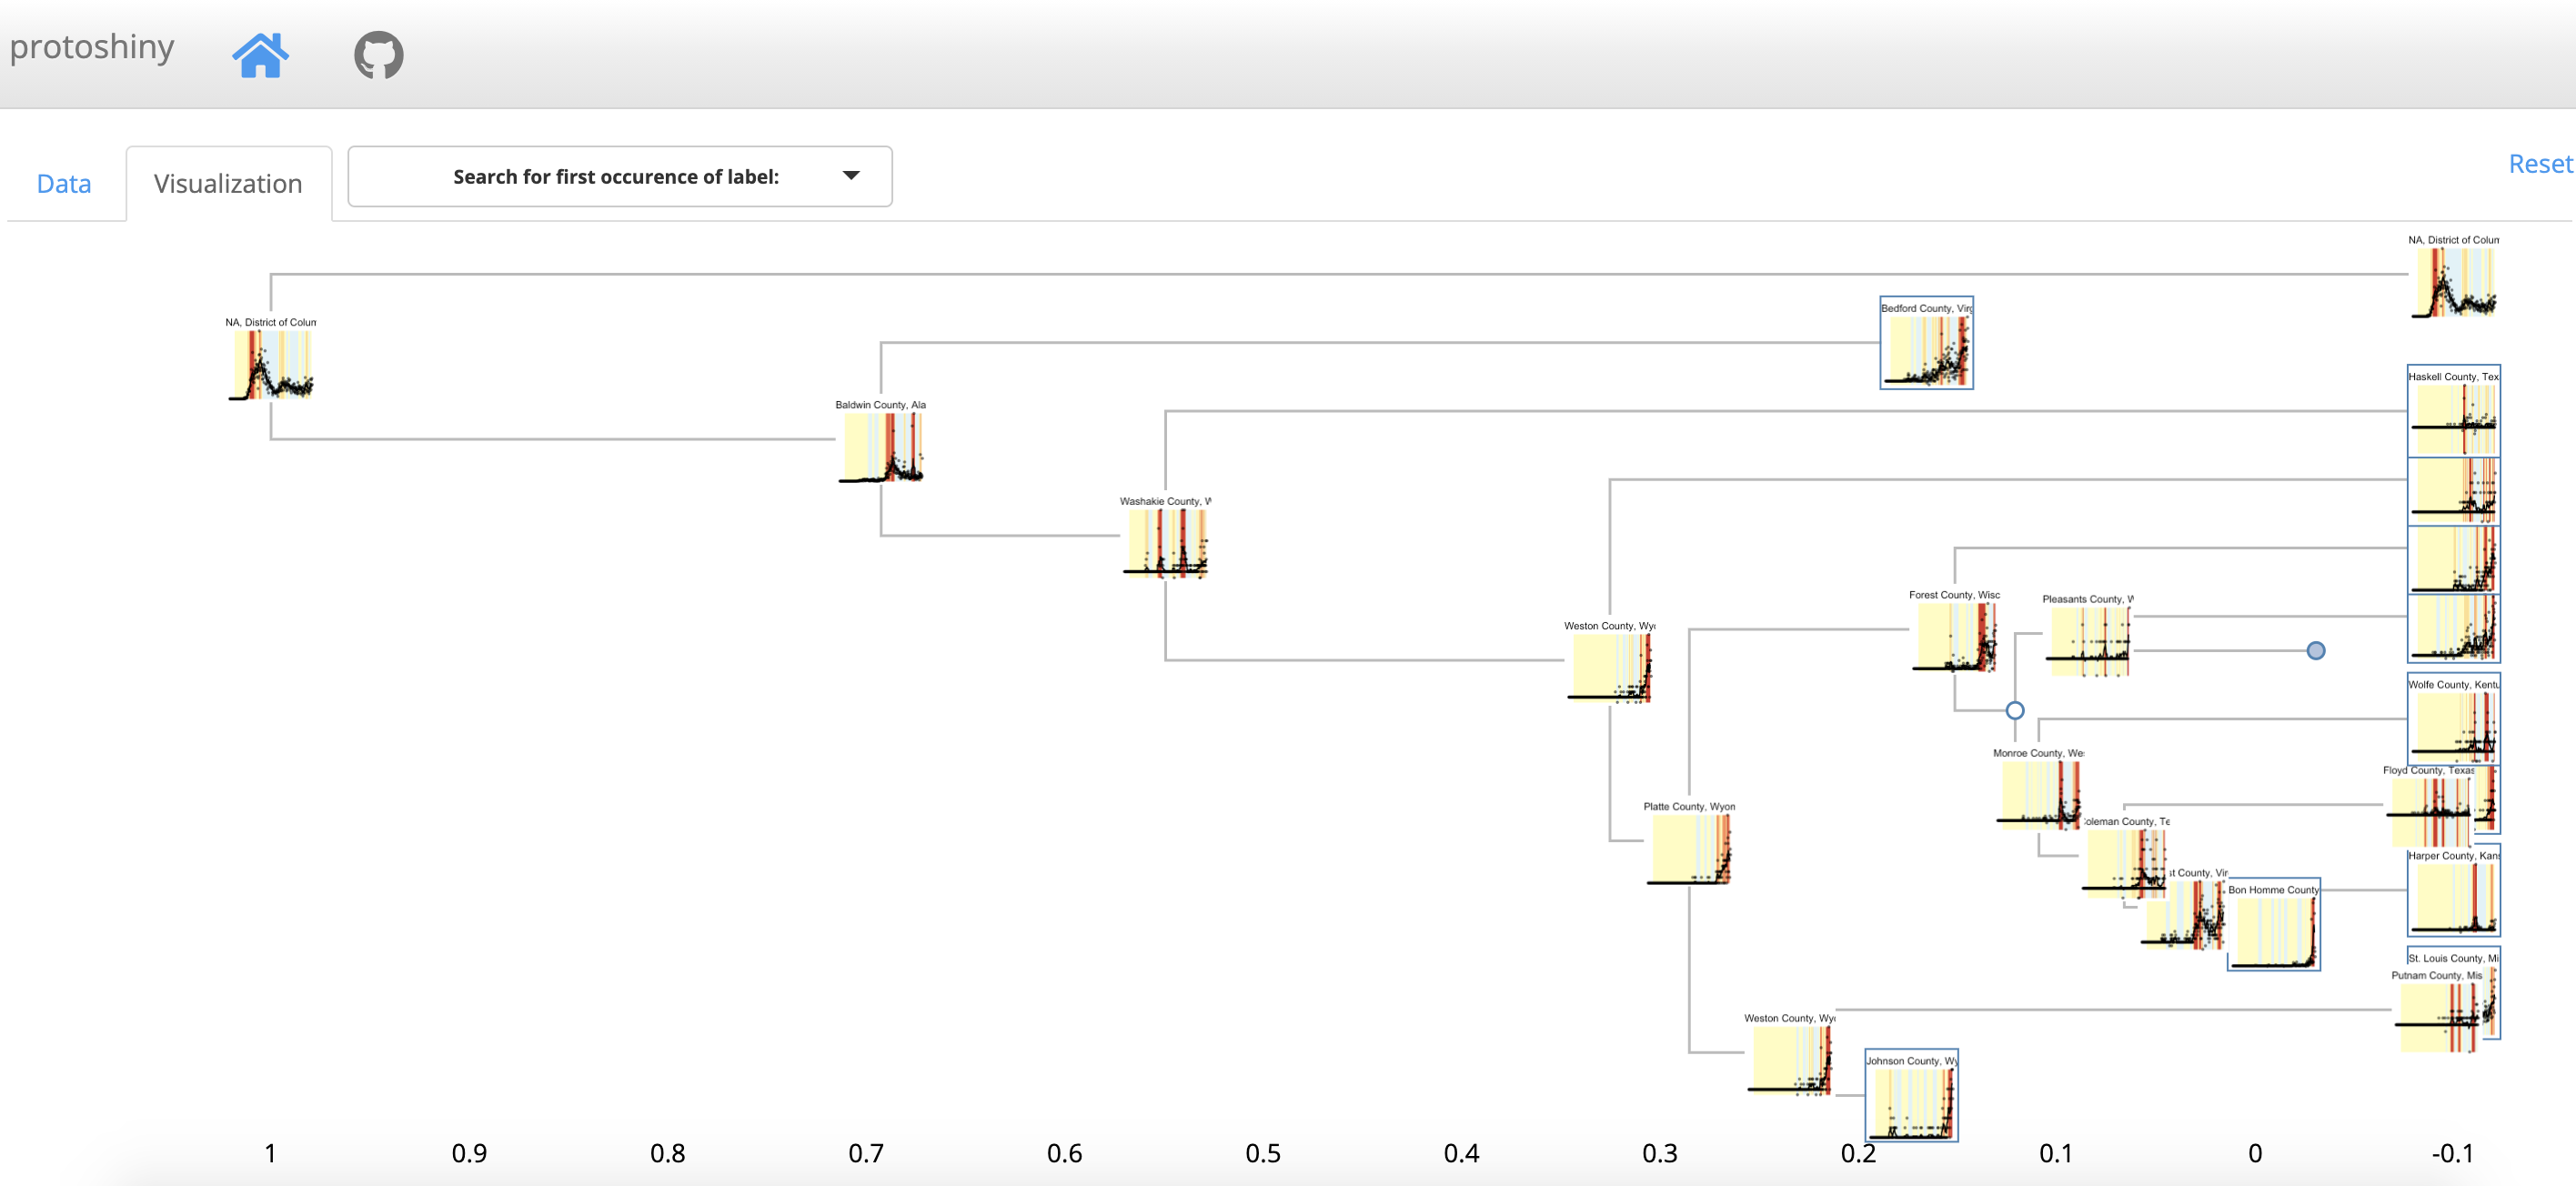
Clustering is one of the principal tools used by data analysts for uncovering the structure present within a data set. Hierarchical clustering is particularly popular since it can reveal multiple scales of groupings at once without forcing the data analyst to commit to a certain number of clusterings. However, hierarchical clustering’s usefulness as a visualization tool is severely degraded by increasing data set sizes. We present an interactive tool that overcomes this difficulty, making hierarchical clustering useful for exploring data sets at scales of interest.
Read more →

Central Processing Units (CPUs) or processors, are the workhorse of modern computing devices. For quite some time, processing manufacturers like Intel and AMD were racing to increase the clock speed (“Gigahertz”) of the processor. More recently, the race has been about increasing the concurrency - adding processor cores that perform tasks in parallel. While many of the lower level libraries in R take advantage of these cores, often there are “embarrassingly parallelizable” tasks we perform in a data analysis that can be drastically sped up via explicit parallelism.
Read more →

This will be a demonstration of the boxr package, which provides an R client to the Box file-sharing service. For example, you can upload and download files to/from your CyBox account using R functions. By far, the biggest hurdle to using boxr is the authentication. Guillermo Basulto will walk us through an authentication example using CyBox; if you will have boxr installed on your computer, you can get this step out of the way during the presentation.
Read more →

Writing unit tests for complicated objects such as text outputs containing many characters, html, .rtf, graphical outputs, etc is very challenging. The new feature in the 3rd edition of testthat package gives the users the ability to record the expected output in a separate file to review by the user instead of using code to describe expected output. It provides tools to automatically generate and update that file as needed. In this presentation, I will go over my recent experience of working with snapshot tests in the 3rd edition of testthat package in validating complicated objects in R.
Read more →

There has been a rapid uptake in the use of non-linear dimensionality reduction (NLDR) methods such as t-distributed stochastic neighbour embedding (t-SNE) in the natural sciences as part of cluster orientation and dimension reduction workflows. The appropriate use of these methods is made difficult by their complex parameterisations and the multitude of decisions required to balance the preservation of local and global structure in the resulting visualisation. We present visual diagnostics for the pragmatic usage of NLDR methods by combining them with a technique called the tour.
Read more →


