Forensic firearms examiners subjectively compare two bullets, using visual examination to make a determination about whether the bullets are similar enough to have originated from the same weapon. Recently, there has been increased demand for quantitative, objective similarity assessment methods for many types of forensic evidence, including bullets. In this talk, we discuss visualizations for a machine learning algorithm capable of matching striation marks on fired bullets. We describe the steps of the algorithm and summary visualizations used at each stage of the data science pipeline, and present an application which wraps the visualizations into an interactive exploration tool.
Read more →

National Student Exchange (NSE) is a non-profit consortium of 165 colleges and universities throughout the United States, Canada, Guam, Puerto Rico, and the U.S. Virgin Islands. NSE provides opportunities for collegiate study away and student exchange among member campuses. NSE recently reached out to Iowa State’s STATCOM chapter for help visualizing survey data. We are hoping to leverage the awesome graphical minds of ISU’s Graphics Group to accomplish two things: (1) have a discussion about visualizing “feedback” survey data, including Likert scale data and qualitative text response data, and (2) have the group spend some time with the data, making visualizations!
Read more →

This will presentation be a grab-bag of three topics:
A re-enactment of my rstudio::conf() talk “Small Team, Big Value: Using R to Design Visualizations”.
Discussion on rstudio::conf() itself.
A preview of what I plan to submit to UseR! (St. Louis), as a lightning talk – the package I worked on at Uncoast Unconf 2019: {steward}, to help you to document datasets. I’d like to see what the group might find useful for this package, as I work on it between now and July.
Read more →

In the time of abundant and sometimes questionable charts by software products we shall not name, it is easy to forget that not too long ago data could not be summarized readily and shown in charts produced with a mere click of a mouse or a few lines of instructions.
In this talk we are going to re-visit some of the historical firsts as well as some of the classical graphics.
Read more →

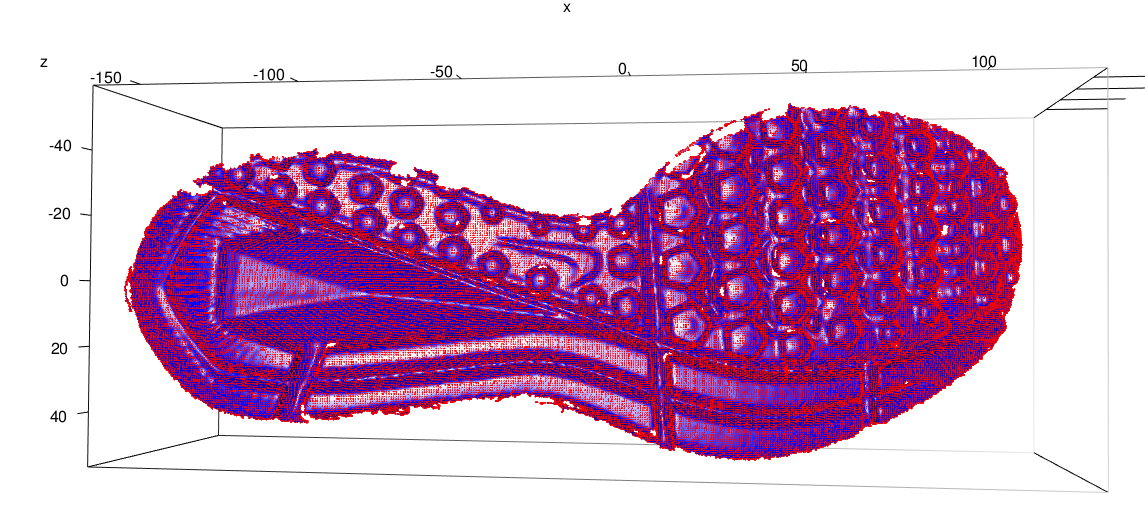
Dealing with 3D data adds a whole new complexity to the simplest of projects, now there is another plane to deal with. Now that 3D scanners and imaging are even more available, the need to work with 3D data is even more relevant. In this talk, we will discuss different ways to not align 3D data, and some possible ways to align them. And maybe some fun pictures along the way.
Read more →


