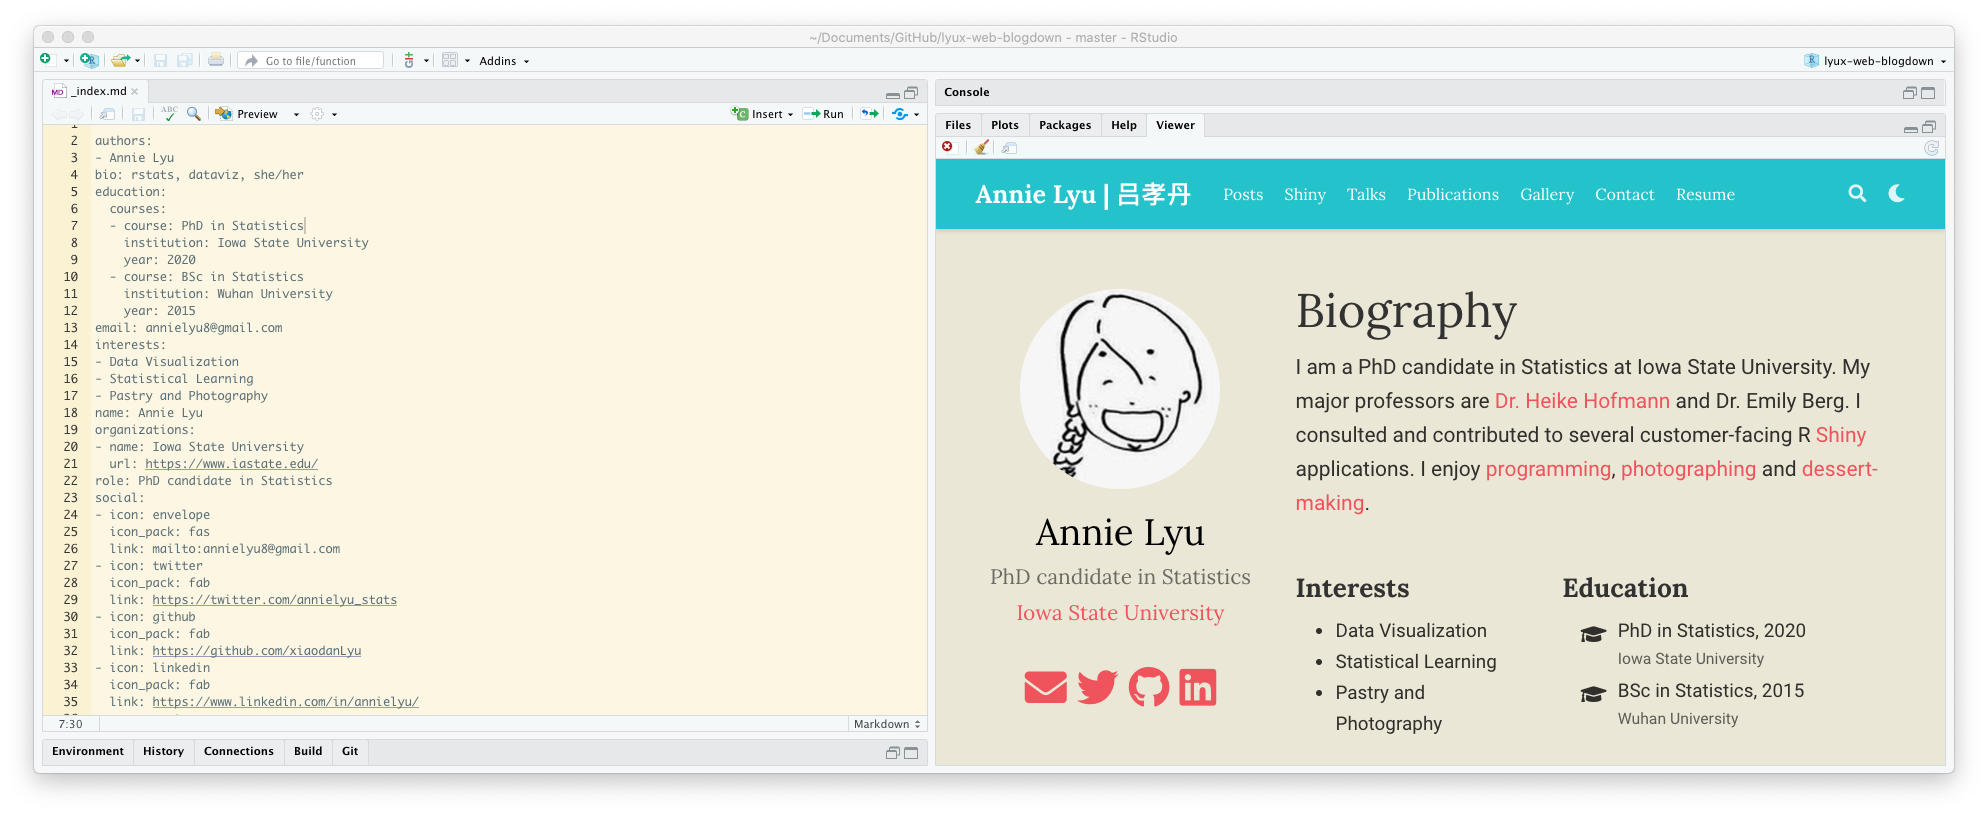
A personal website is an incomparable platform for building your online profile and showcasing your amazing work (research or other interesting stuff). Blogdown is a popular R package developed for producing a static website from R Markdown documents. Even if you are currently using GitHub pages for your personal website, you might be interested in this talk after reading this post by Yihui. In this talk, we’ll introduce some tips and tricks for building a personal website with Blogdown based on our own experience.
Read more →

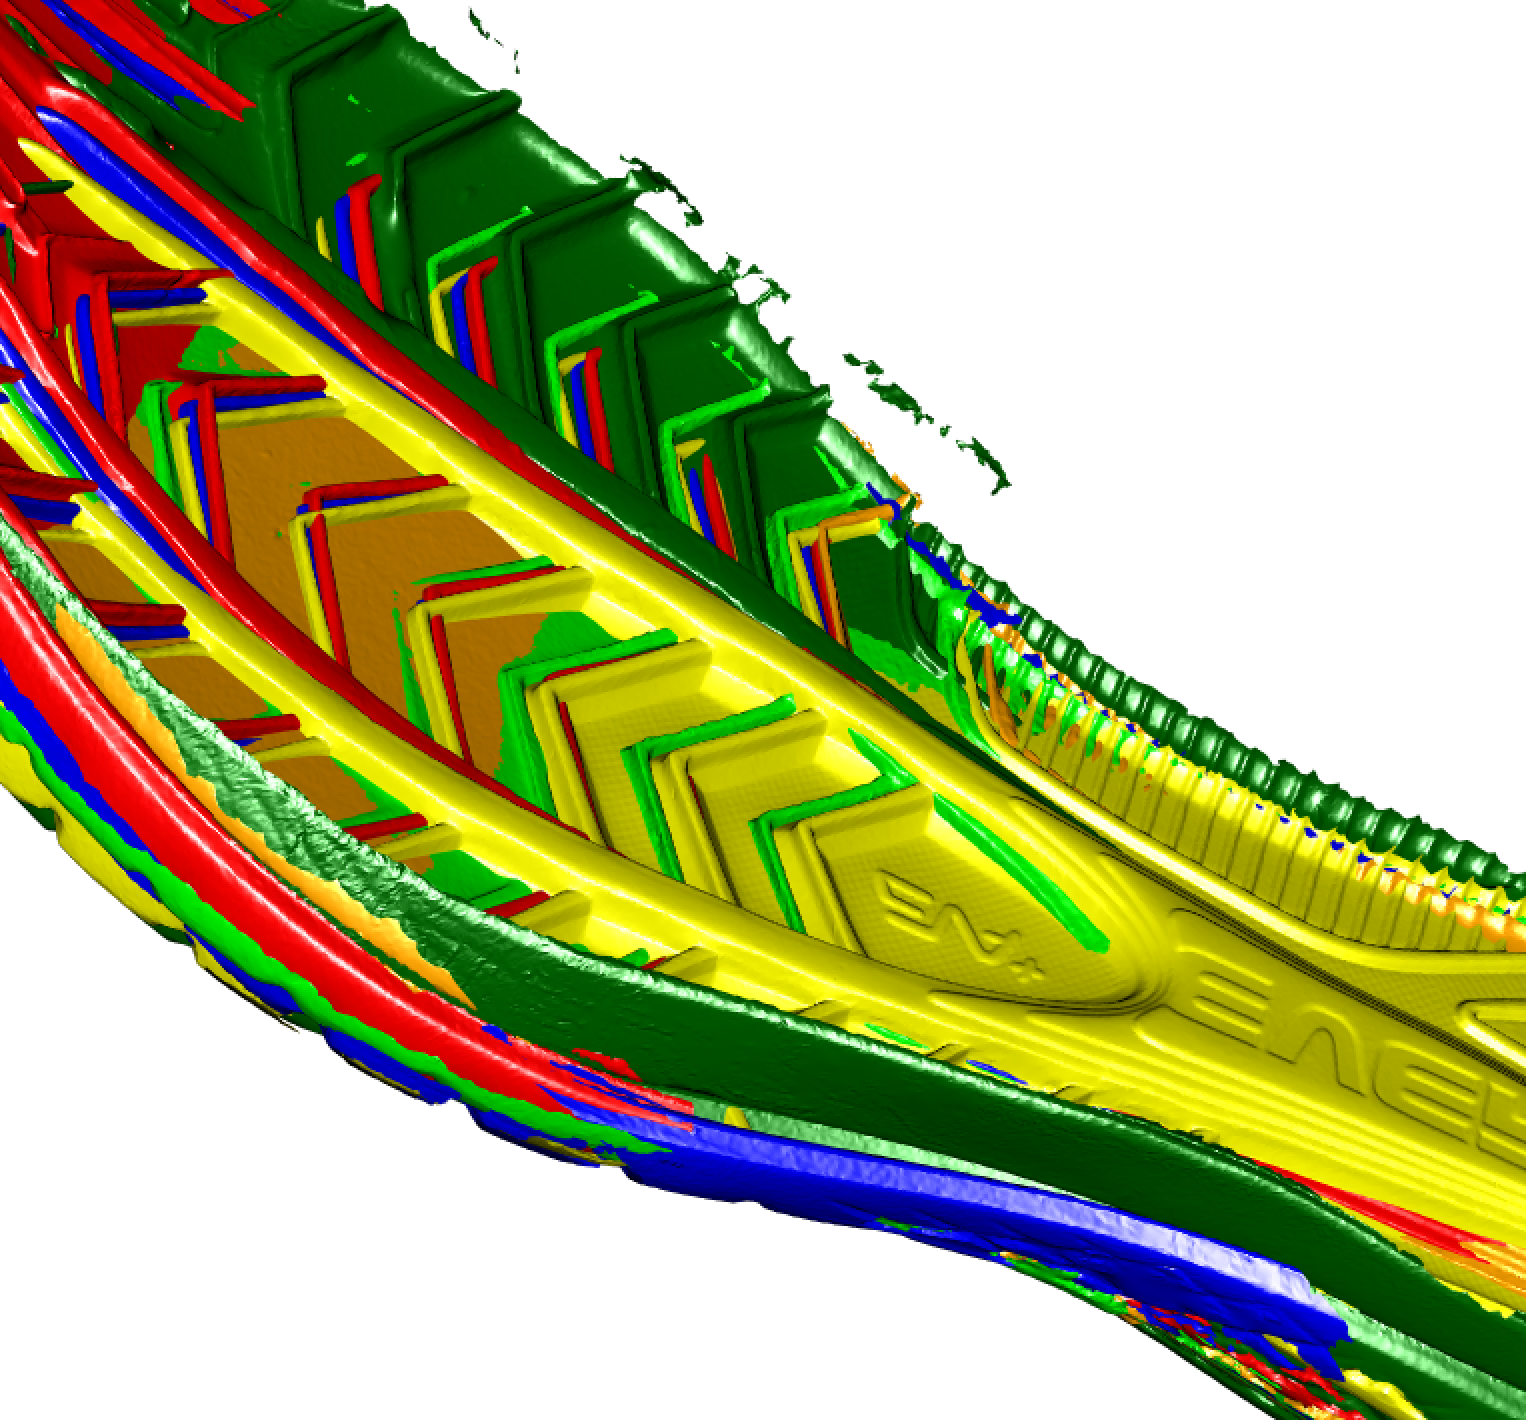
Shoe analysis is frequently used as part of forensic analysis. However, dealing with time, the wear of the sole and its features can be difficult. Here we present a method for extracting the wear between two 3D scans of a single shoe after some amount of use, using an iterative alignment process, in order to discover matching methods after a large amount of wear. Initial processing transforms a Standard Triangle Language (stl) 3D object, into a triangle mesh before alignment.
Read more →

Taking projections of high-dimensional data is a common analytical and visualisation technique in statistics for working with high-dimensional problems. Sectioning, or slicing, through high dimensions is less common, but can be useful for visualising data with concavities, or non-linear structure. It is associated with conditional distributions in statistics, and also linked brushing between plots in interactive data visualisation. This talk will describe the simple approach for slicing in the orthogonal space of projections obtained when running a tour, thus presenting the viewer with an interpolated sequence of sliced projections.
Read more →

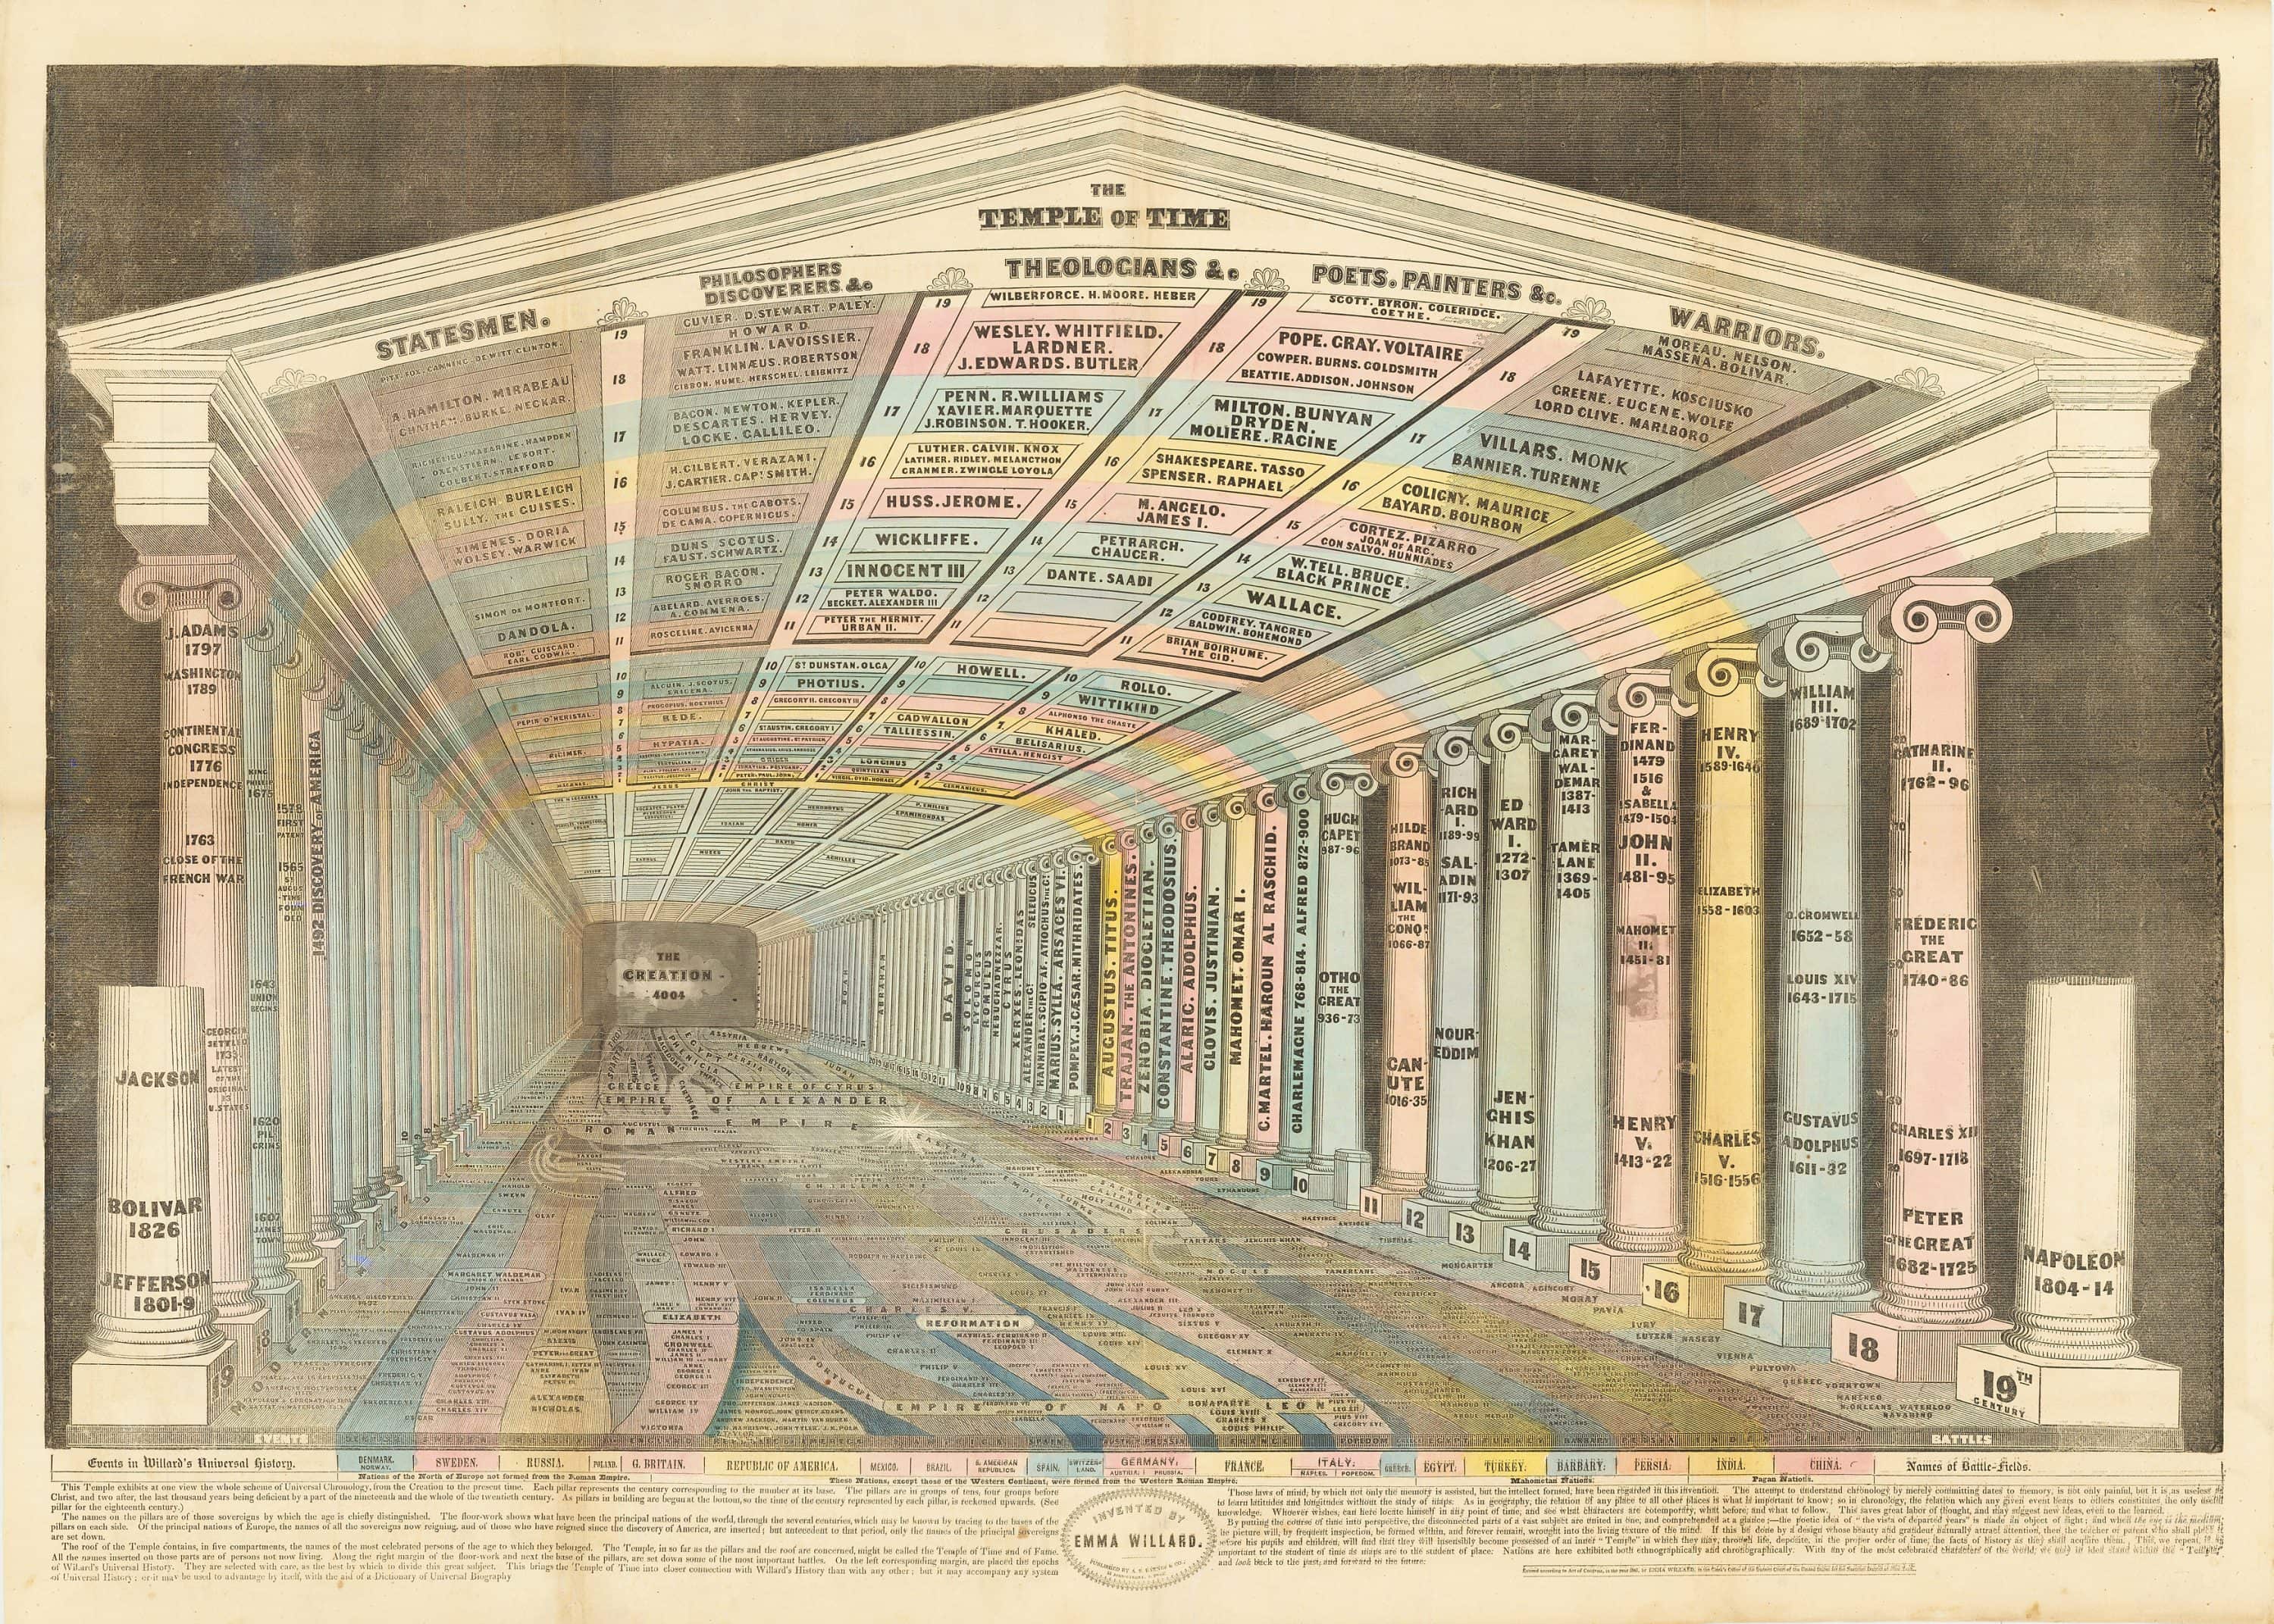
In this talk we are going to re-visit some of the historical firsts as well as some of the classical graphics. William Playfair - Scottish engineer and British secret agent gave us a few of those firsts: line charts, barcharts, and also, alas, pie charts. Looking at graphics created at a time when visualizing out-of-the-box was the only way to go, hopefully also allows us to break through our box and inspires us to visualize things a little differently.
Read more →

In today’s day and age, U.S. society is inundated with information about politics and elections from all around the world. Particularly in a U.S. Presidential election year, the news is full of predictions, results, and stories about the primary and Presidential elections. The key to effectively communicating a message about election data lies in graphical presentation of statistical information. In this talk, I will present a history of innovation in election graphics including results, predictions, voter turnout, and campaigns and advertising.
Read more →


