In the recent years, RStudio has ported Leaflet, a widely used open-source JavaScript library for creating interactive maps, to R as a package called leaflet and has made it possible to create maps in R using the familiar ggplot2 style syntax. Additionally, a bunch of Leaflet plugins that extend Leaflet’s functionalities have also been ported to R by the community members, enabling users to create a variety of maps with ease.
Read more →

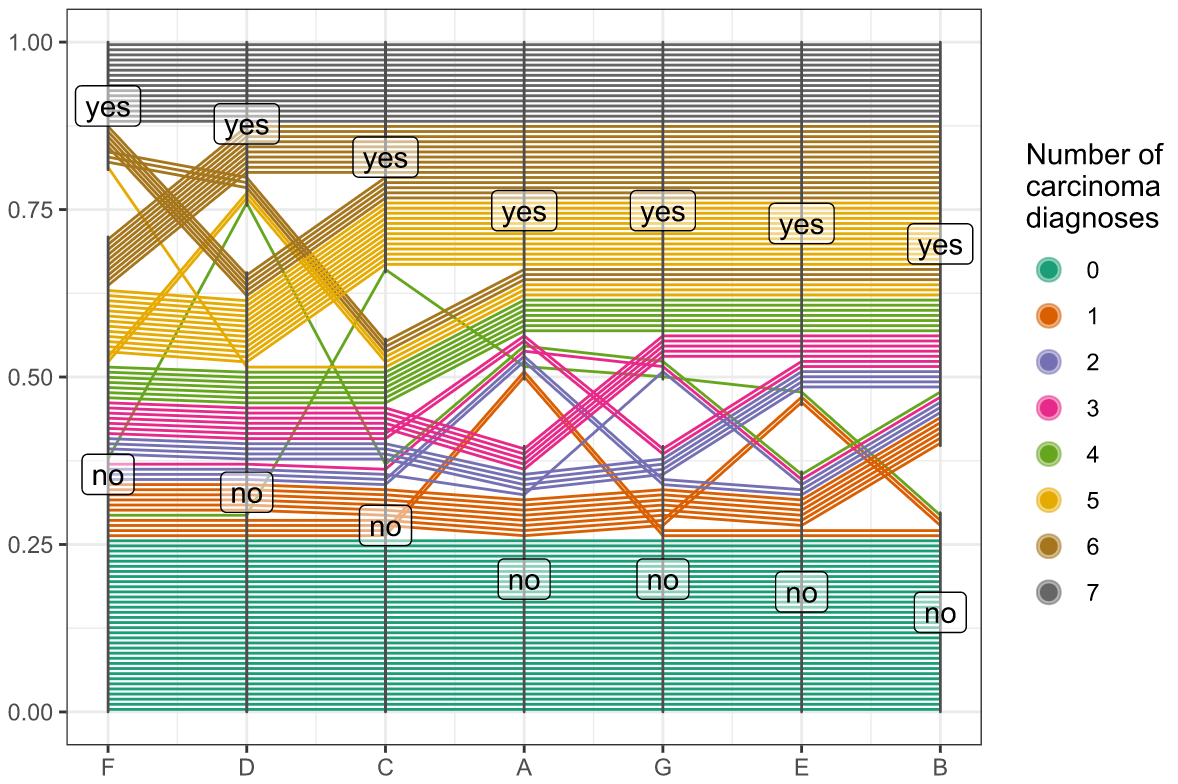
ggpcp is an R package developed for the generalized parallel coordinate plots which are a useful set of graphics for visualizing data with more than 2-dimensions. It is generalized in the sense of combining numeric and categorical variables together while keeping the ability to track each observation. It helps to see some interesting aspects of the “high”-dimensional data.
Read more →

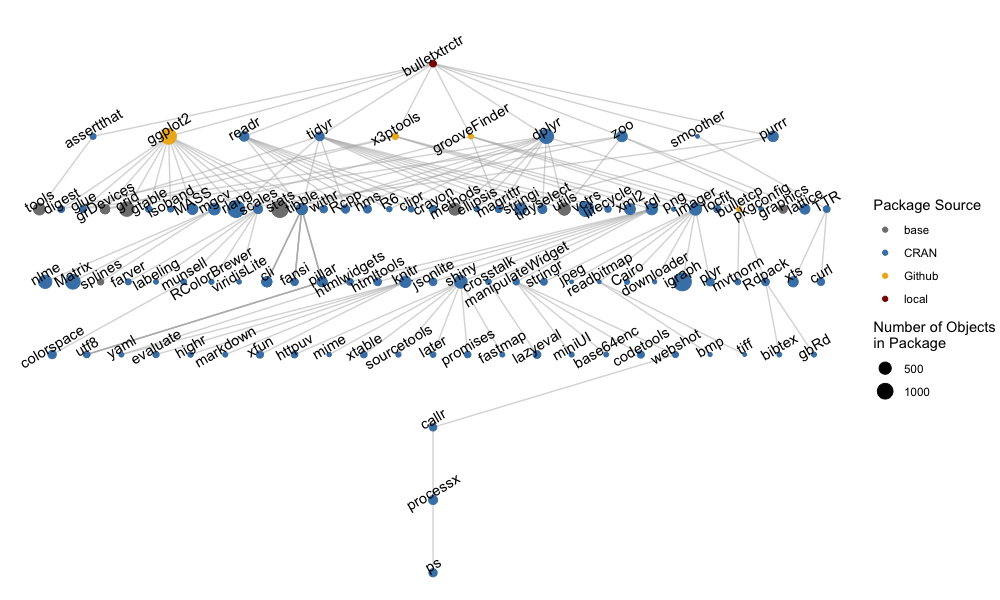
Most modern data analysis requires the use of statistical software. The results of data analysis then rely on the underlying software utilized and the actions applied to data. R, one of the most widely-used statistical softwares for data analysis, relies on user-developed “packages” for many data science and data analysis tasks. These packages are subject to change over time, which can impact computational reproducibility efforts, as well as frustrate users who are left to hunt down problems in broken code.
Read more →

While eating jellybeans isn’t as hazardous in the real world as in the Harry Potter universe, it can still be unexpectedly interesting: you think you have a few raspberry flavored beans, but how do you know one of them isn’t actually cinnamon? In an effort to combat this anxiety-inducing problem, we collected several sets of image data. I’ll talk about how we applied computer vision techniques to isolate the beans and extract useful features from the images (as well as the associated challenges).
Read more →

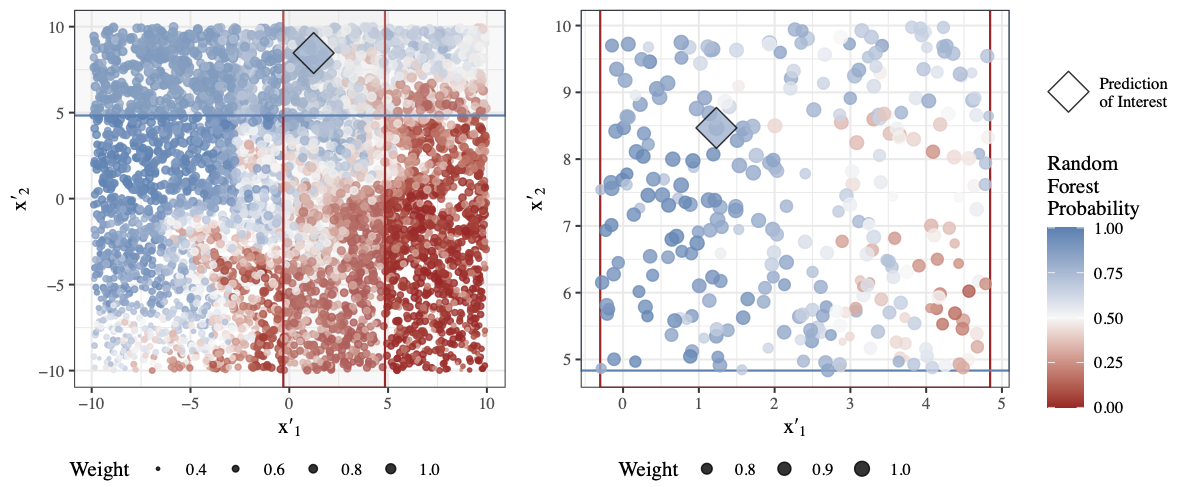
Machine learning models are excellent predictors, but it is impractical to interpret many of these models. Despite this impracticality, it is important to be able to explain predictions to assess and validate models. As a result, a field of research has recently developed in the explainability of machine learning models. In this talk, I will provide an overview of explainable machine learning with a focus on visualization methods. I will discuss philosophies of “explainability”, model agnostic and model specific visualization methods, and code for creating some of the visualizations in R.
Read more →


