Drawing inference from lineups

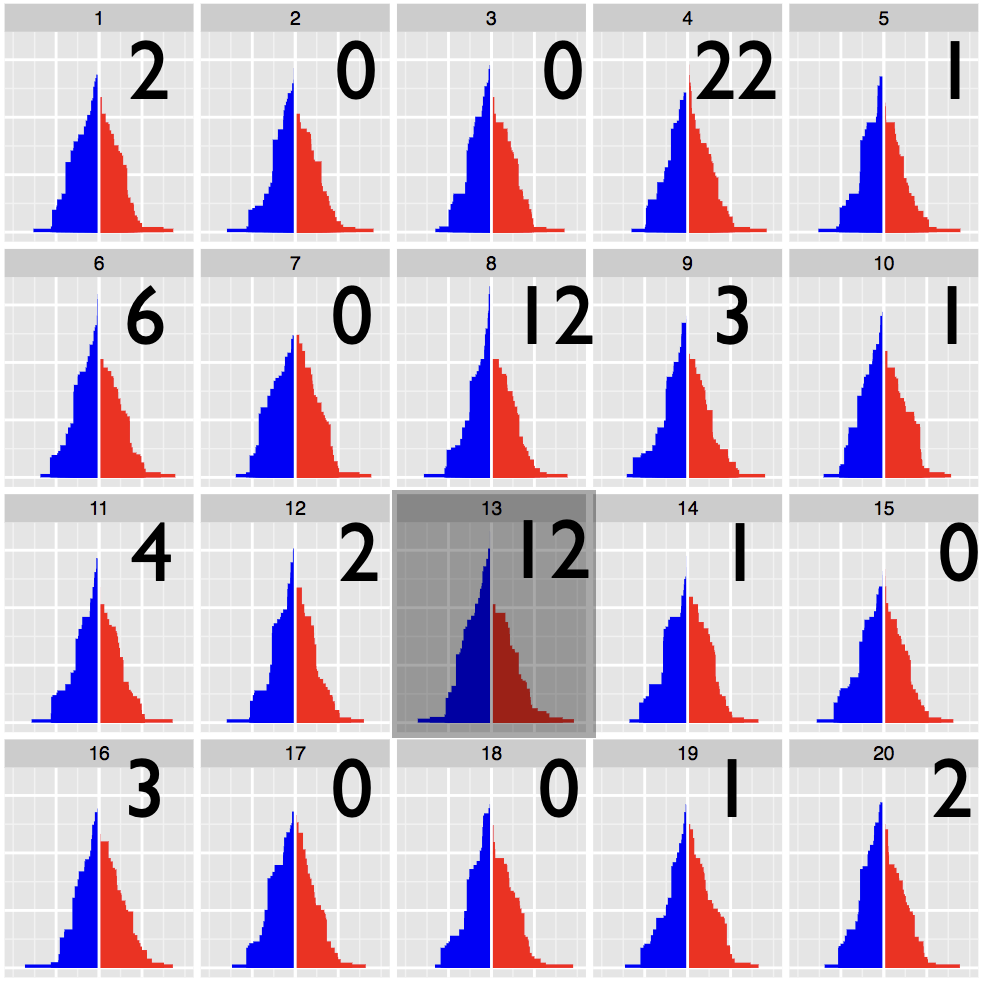
Statistical inference provides the protocols for conducting rigorous science, but data plots provide the opportunity to discover the unexpected. These disparate endeavors are bridged by visual inference, where a lineup protocol can be employed for statistical testing. Human observers are needed to assess the lineups, typically using a crowd-sourcing service. In this talk we will discuss how to calculate statistical significance associated with the results from applying a lineup protocol. Our approach utilizes a Dirichlet distribution to accommodate different levels of visual interest in individual null panels. The suggested procedures facilitate statistical inference for a broader range of data problems.
