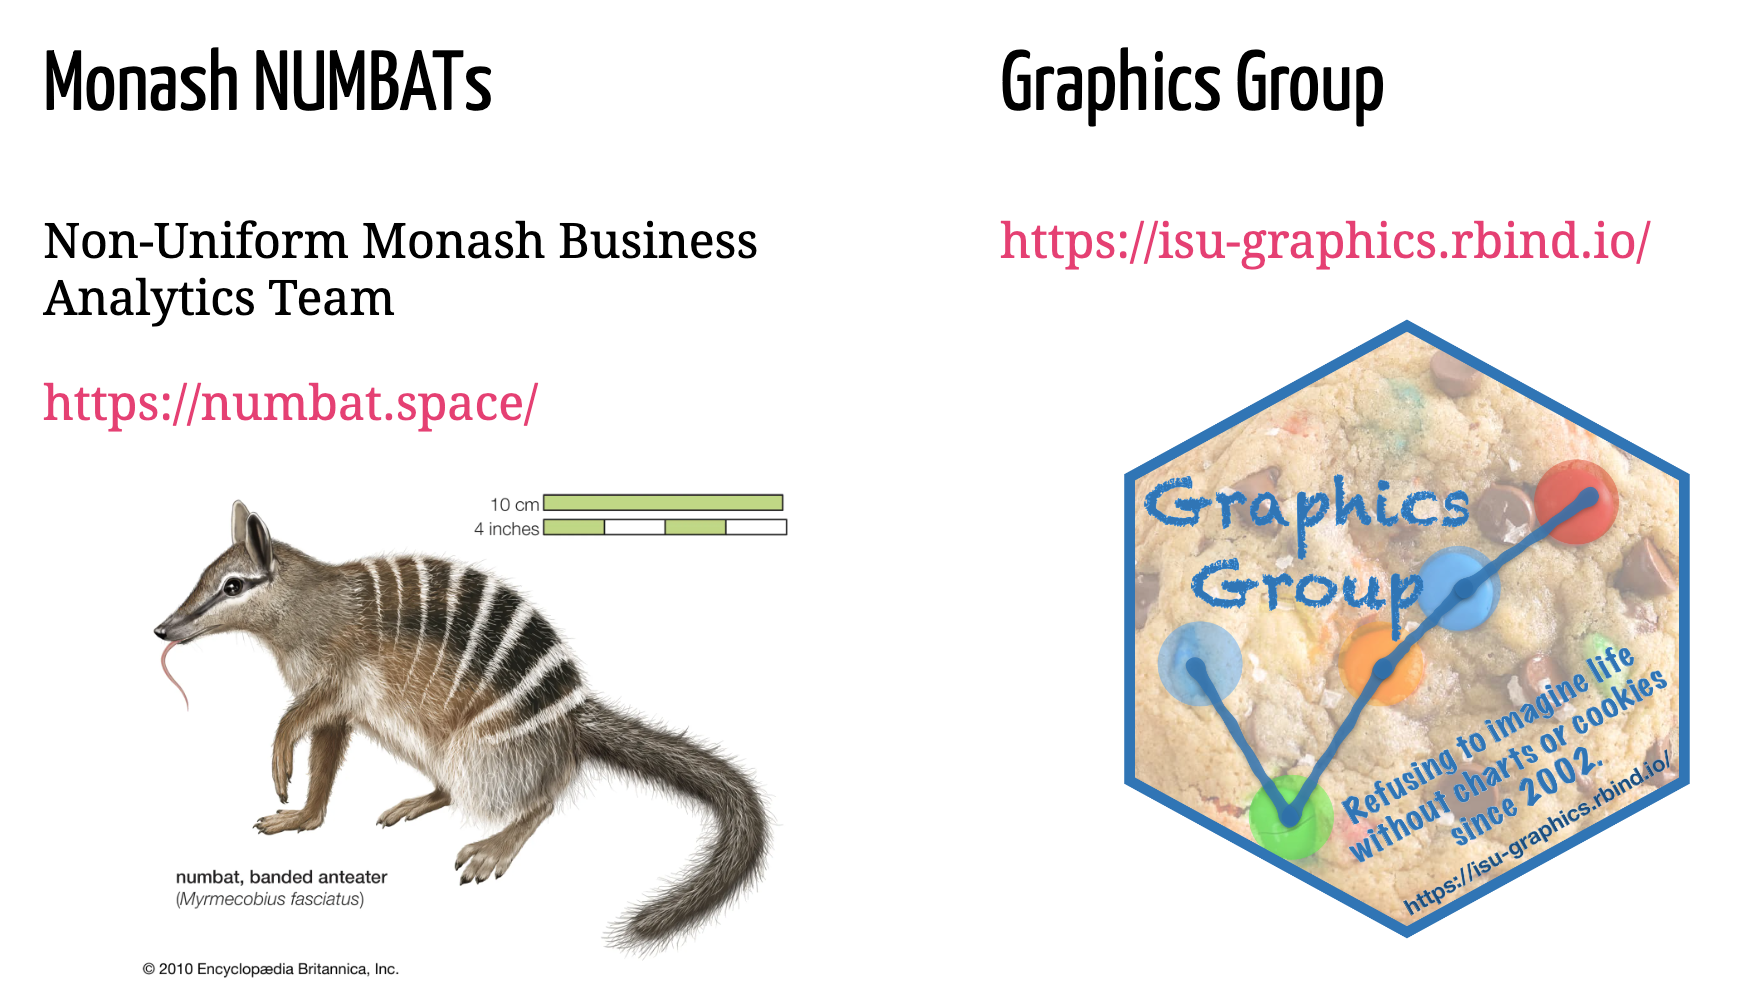
This week are going to have a global crossover shared meeting, with Iowa/Nebraska Graphics Group and Australian NUMBATs, with pizza! We are going to talk about favorite R packages, hidden gems, love/hate packages, and our own package contributions. It is a chance to meet like-minded people on the other side of the globe. In preparation, please tell us about your package stories (link to survey sent to Denise)
slides: https://isu-graphicsgroup.github.io/slide-storage/2022/2022-11-10-made-with-glue/made-with-glue.html#1
Read more →

A popular strategy for visually summarizing bivariate data is plotting contours of an estimated density surface. Most commonly, the density is estimated with a kernel density estimator and the plotted contours correspond to equally spaced intervals of the estimated density’s height. Notably, this is the case for geom_density_2d() and geom_density_2d_filled() from ggplot2. ggdensity extends ggplot2, providing more interpretable visualizations of density estimates based on highest density regions (HDRs). geom_hdr() and geom_hdr_lines() serve as drop-in replacements for the aforementioned ggplot2 functions, plotting density contours that are chosen to be inferentially relevant.
Read more →

The litR R package lets you write a complete R package in a single R markdown document. This enables a workflow for writing R packages that is probably very different from what you are used to. http://faculty.marshall.usc.edu/jacob-bien/litr/docs/index.html
Read more →

This week we will watch Alison Hill talk with the Cleveland R User group about making R Markdown a better integrated tool for your work. Alison Hill is a data scientist, behavioral scientist, and an award-winning educator. At RStudio, Dr. Hill works to expand how data scientists can communicate when they use RStudio’s tools for collaborating, sharing, and presenting. Alison loves teaching, and has led advanced workshops on data science communication and machine learning at rstudio::conf, R / Medicine, and R in Pharma.
Read more →


