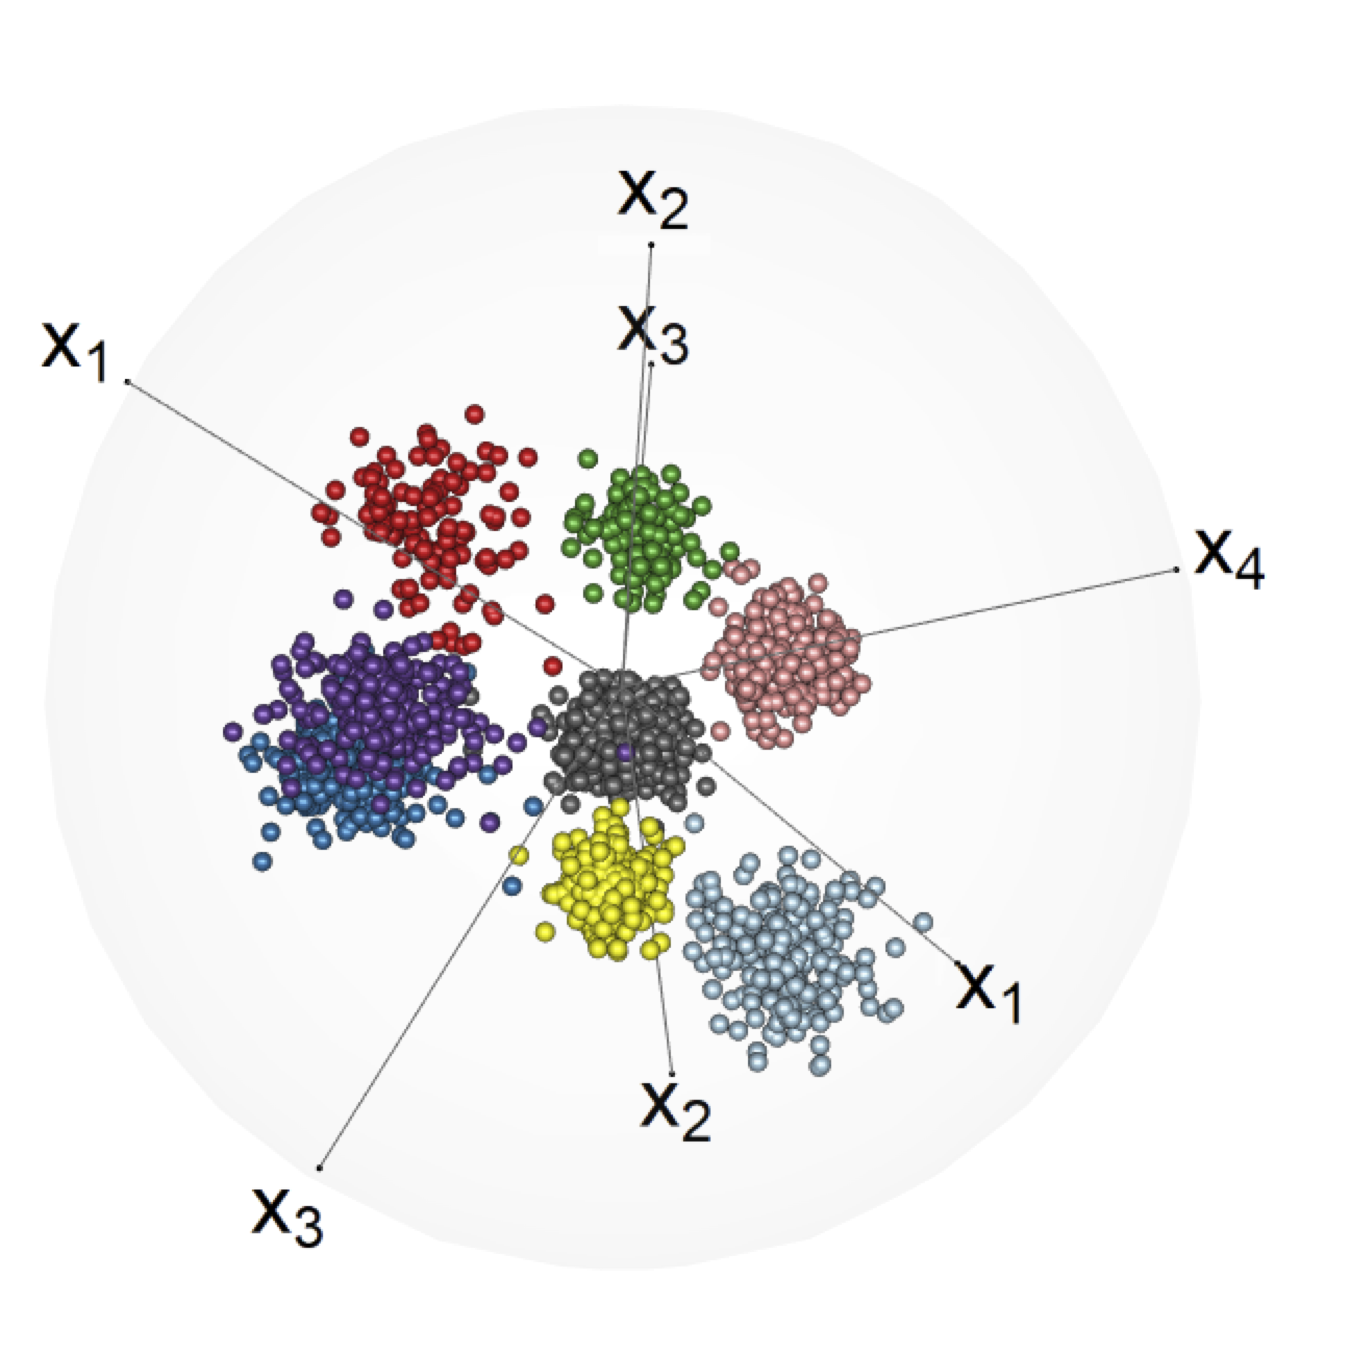
We develop methodologies for 3D radial visualization of high-dimensional datasets. Our display engine is called RadViz3D and extends the classic RadViz that visualizes multivariate data in the 2D plane by mapping every record to a point inside the unit circle. The classic RadViz display has equally-spaced anchor points on the unit circle, with each of them associated with an attribute or feature of the dataset.
Read more →
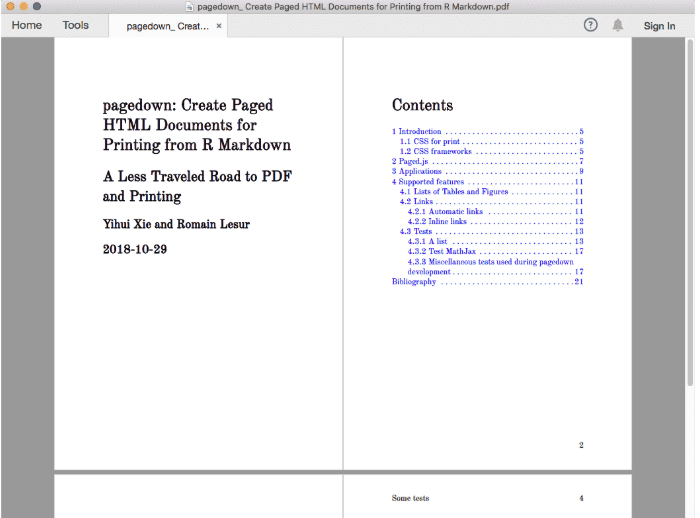
I briefly talked about pagedown at rstudio::conf 2019 (https://resources.rstudio.com/rstudio-conf-2019/pagedown-creating-beautiful-pdfs-with-r-markdown-and-css) but did not explain the details due to the length of the talk. This time I will talk about it in depth. I will also demonstrate my last R package rolldown for storytelling with R Markdown (https://github.com/yihui/rolldown).
The slides for the talk can be found here.
Read more →
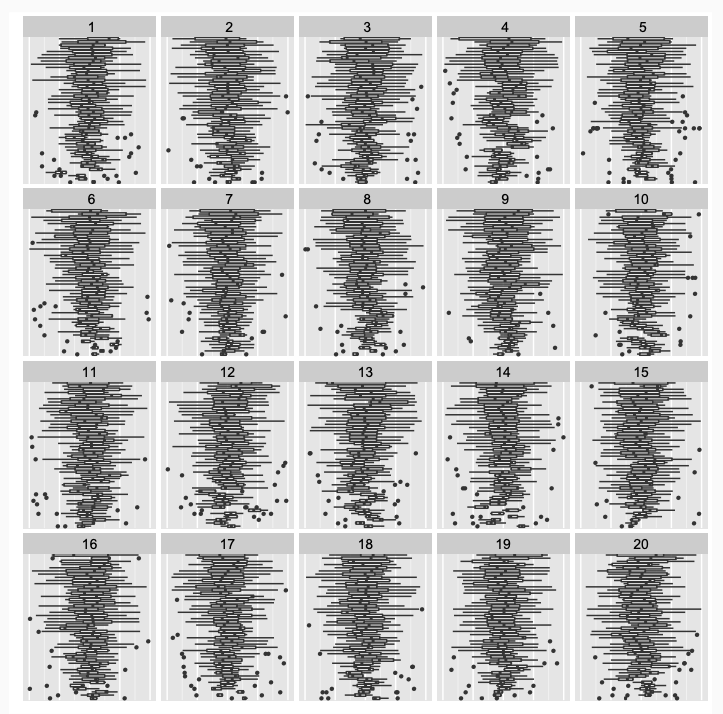
We live in a world where both statistical learning models and computer visions models allow many tasks to be automated, ranging from detecting fraudulent credit card transactions to self-driving cars. Based on these advances, it seems reasonable to ask whether we can automate the evaluation of common statistical graphics, such as residual plots.
Statistical graphics are commonly used for exploratory data analysis and model checking, however, they are often criticized due to the subjectivity involved in their interpretation.
Read more →
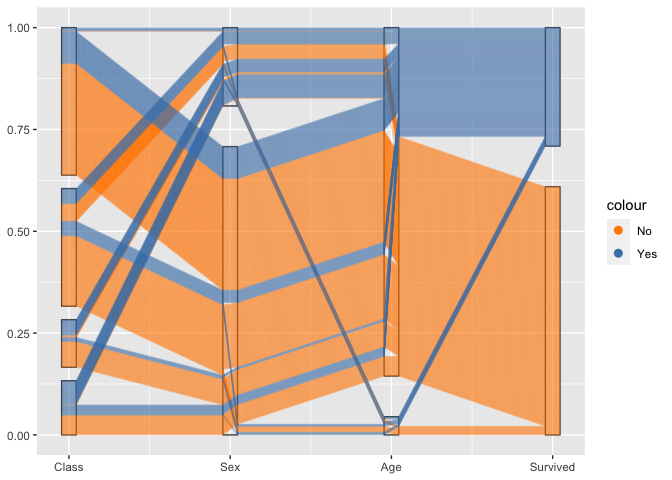
Parallel coordinate plot is well used to show data with dimensions more than three, which provides an elegant way of displaying data with such many dimensions by representing each variable by an axis. Parallel coordinate plot works well with continuous variables but not categorical variables. Some improved versions of parallel coordinate plots were introduced to show categorical variables in a similar way as in numeric variable cases, such as parallel set plots, hammock plots and common angle plots.
Read more →
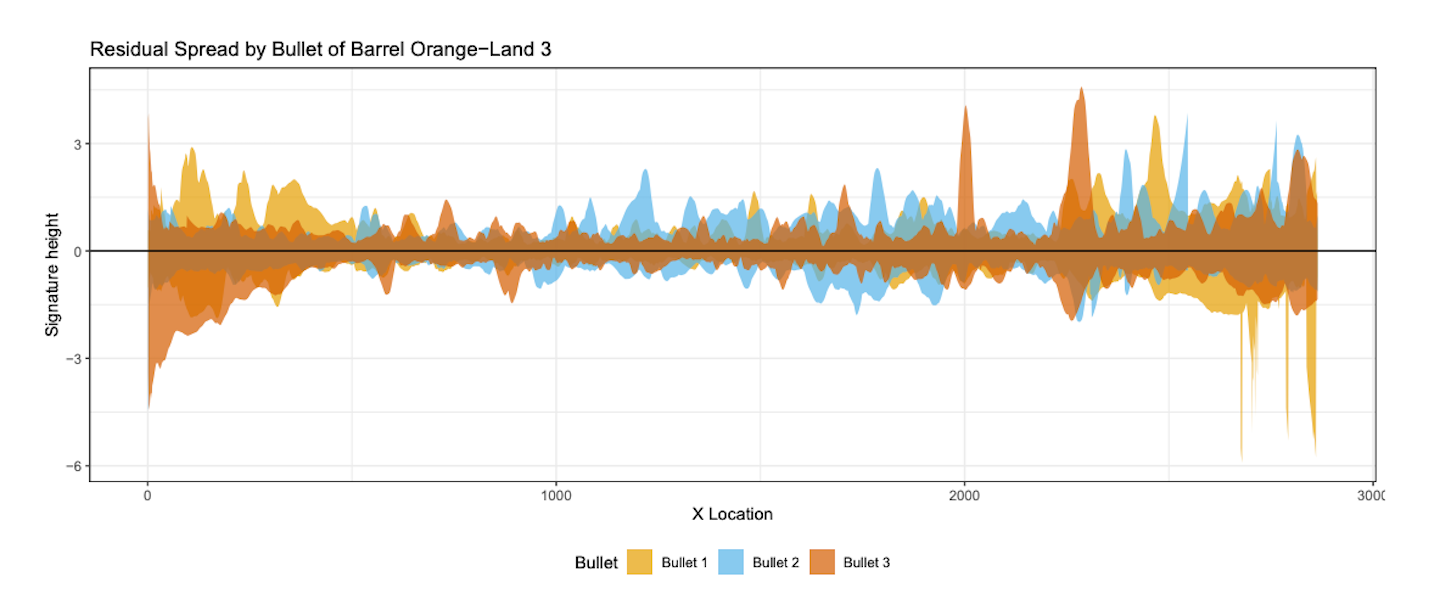
The field of forensic firearms analysis involves the visual comparison of patterns engraved on bullets by the barrel of a gun. In recent years, computer vision techniques have been developed to complete these visual comparisons in an automated fashion. These methods, such as the one developed by Heike Hofmann and Eric Hare, are based on high-resolution images of bullet lands. We collected repeated scans of a small set of bullets in order to study the variability introduced by human involvement in the scanning process.
Read more →


