Interactive Data Visualization in Production

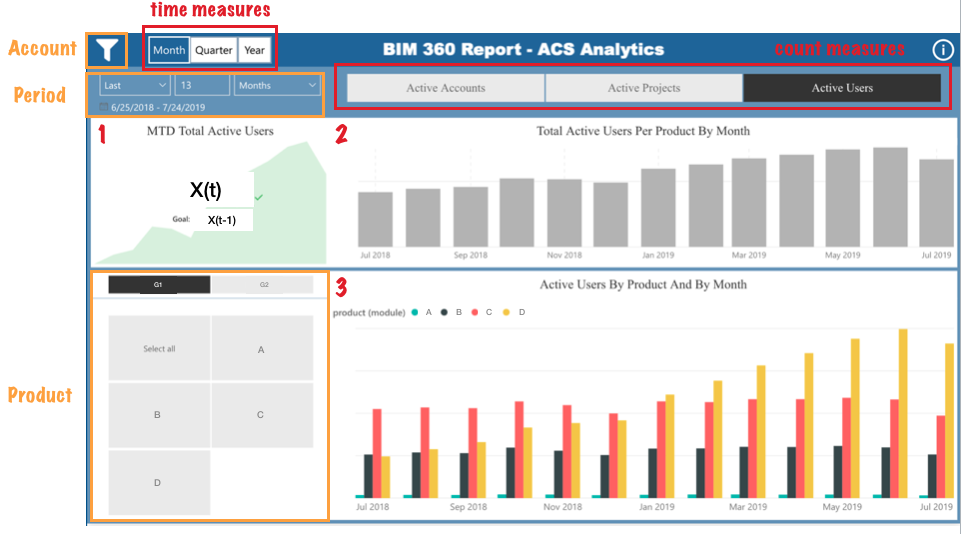
Interactive data visualization (dashboards) are often used to show important measures or key performance indicators (KPI) at a comprehensible level of aggregation and are continuously updated as new data are added to the database. In this talk, I’ll present a full procedure of developing a dashboard from data engineering to data visualization taken from my summer internship as a visualization analyst at Autodesk. Some recommended practices such as choosing appropriate charts and designing effective dashboards will be discussed. I’ll also share my experience in communicating statistical models with non-tech decision-makers.
